## Screenshot of Statistical Analysis Report
### Overview
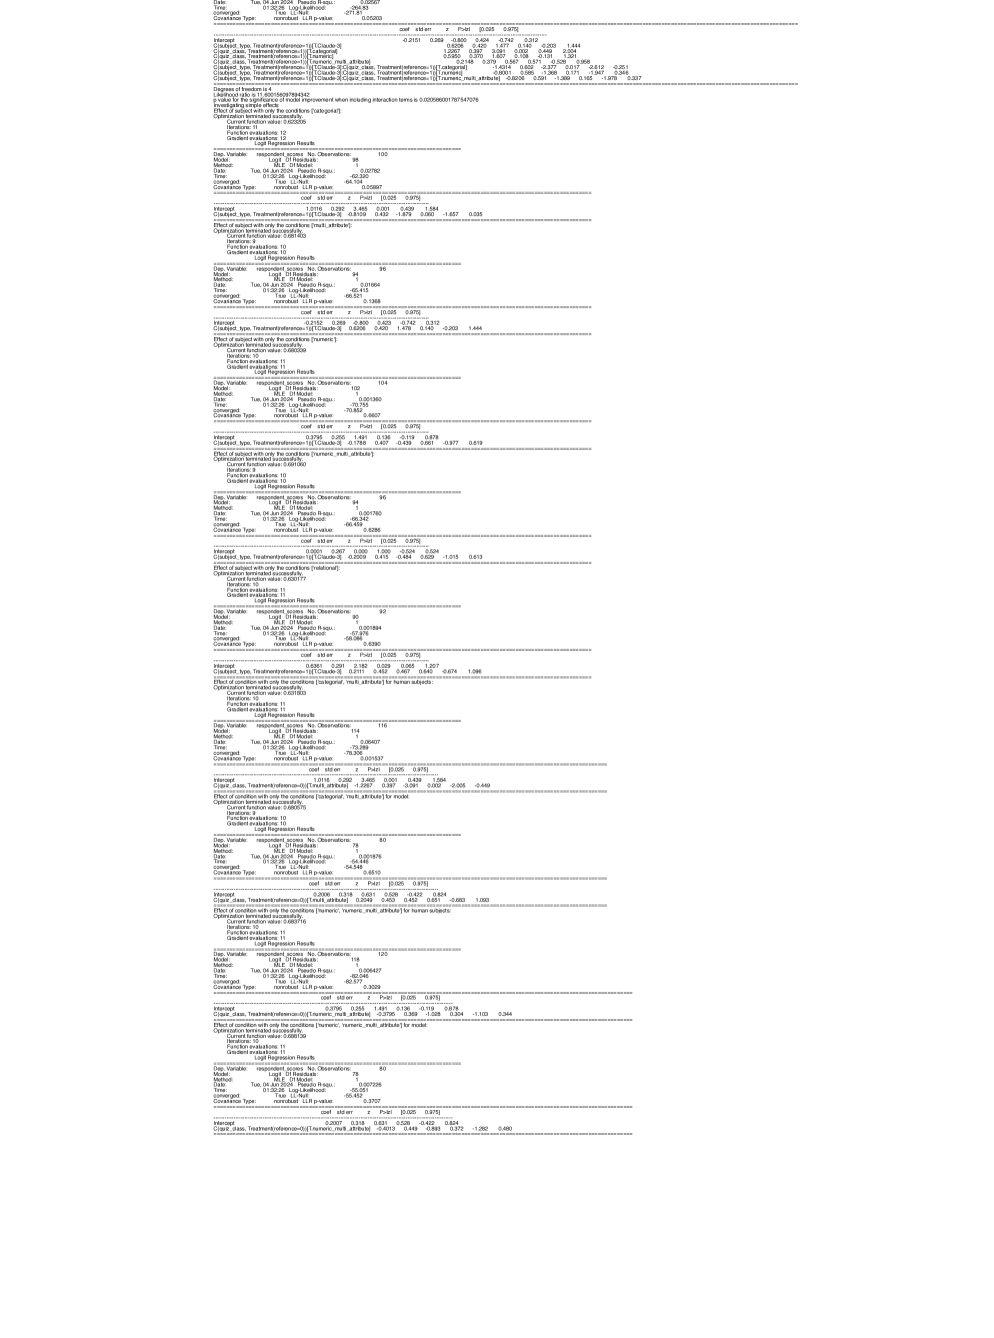
The image displays a technical document containing statistical analysis results, likely from a regression or machine learning model evaluation. The content is organized into multiple sections with headings, tables, and charts. The text is too small to read clearly, but the structure and formatting suggest a focus on model comparisons, statistical metrics, and visualizations of results.
---
### Components/Axes
#### Headings and Sections
- **Model**: Repeatedly listed with dates (e.g., "Model: MLE_D1", "Model: MLE_D2").
- **Method**: Specifies analysis techniques (e.g., "Method: Logit", "Method: Logistic Regression").
- **Date**: Timestamps for data collection or model runs (e.g., "Date: 04-Jun-2024").
- **Logit Regression Results**: Charts and tables summarizing model outputs.
#### Table Columns (Inferred)
- **Date**: Timestamp for data/model run.
- **Model**: Model type (e.g., MLE, MLE_D1, MLE_D2).
- **Method**: Analysis method (e.g., Logit, Logistic Regression).
- **Logit**: Coefficient estimates or model outputs.
- **Residuals**: Residual values or error metrics.
- **p-value**: Statistical significance of coefficients.
- **z**: Standardized coefficients.
- **Pr(>|z|)**: p-values for hypothesis testing.
---
### Detailed Analysis
#### Repeated Sections
1. **Model: MLE_D1**
- **Method: Logit**
- Date: 04-Jun-2024
- Logit Regression Results: Coefficients, residuals, p-values.
- **Method: Logistic Regression**
- Similar structure with additional metrics.
2. **Model: MLE_D2**
- **Method: Logit**
- Date: 04-Jun-2024
- Logit Regression Results: Coefficients, residuals, p-values.
- **Method: Logistic Regression**
- Similar structure with additional metrics.
#### Charts
- **Logit Regression Results**: Likely visualizations of coefficient estimates, confidence intervals, or model fit statistics (e.g., AIC, BIC).
- **Residual Plots**: Scatterplots or histograms of residuals to assess model fit.
---
### Key Observations
1. **Repetition**: Multiple sections repeat the same structure, suggesting comparisons across models/methods.
2. **Statistical Focus**: Emphasis on p-values, coefficients, and residuals indicates hypothesis testing and model validation.
3. **Unreadable Text**: Exact numerical values and labels cannot be extracted due to image resolution.
---
### Interpretation
The document appears to evaluate different statistical models (e.g., MLE variants) using Logit and Logistic Regression methods. The repeated sections suggest a comparative analysis of model performance, with a focus on statistical significance (p-values) and coefficient estimates. The charts likely summarize these results visually, aiding in interpretation. However, the inability to read the text prevents precise extraction of numerical data or conclusions.
---
### Limitations
- **Image Quality**: Text is too small to read, making exact transcription impossible.
- **Ambiguity**: Without clear labels, specific model details (e.g., variables, datasets) cannot be confirmed.