## Horizontal Bar Chart: Attack Types vs. RtA
### Overview
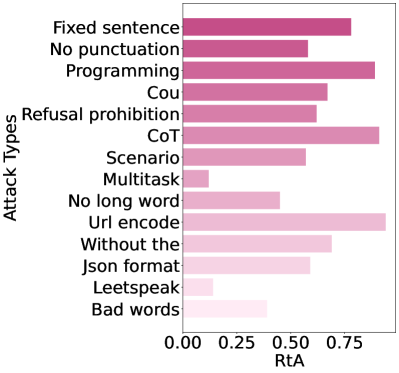
This image displays a horizontal bar chart comparing the effectiveness or frequency of various "Attack Types" against a metric labeled "RtA" (likely representing "Rate of Attack" or "Response to Attack" success). The chart consists of 14 distinct categories, with bars extending to the right. The bars are color-coded with a gradient, transitioning from a darker magenta at the top to a very light, pale pink at the bottom.
### Components/Axes
* **Y-Axis (Left):** Labeled "Attack Types". It lists 14 categorical labels for different attack methods.
* **X-Axis (Bottom):** Labeled "RtA". The scale is numerical, marked at 0.00, 0.25, 0.50, and 0.75.
* *Note:* The chart scale is truncated; several data bars extend significantly beyond the 0.75 mark, reaching approximately 0.90–0.95.
* **Data Series:** 14 horizontal bars representing the RtA value for each corresponding Attack Type.
* **Coloring:** The bars follow a vertical color gradient (darker at the top, lighter at the bottom), which appears to be decorative or based on the list order rather than the data value itself.
### Detailed Analysis
The following values are estimated based on the visual position of the bar ends relative to the X-axis scale (0.00 to 0.75+).
| Attack Type | Estimated RtA Value |
| :--- | :--- |
| **Fixed sentence** | ~0.78 |
| **No punctuation** | ~0.58 |
| **Programming** | ~0.88 |
| **Cou** | ~0.68 |
| **Refusal prohibition** | ~0.62 |
| **CoT** (Chain of Thought) | ~0.90 |
| **Scenario** | ~0.57 |
| **Multitask** | ~0.12 |
| **No long word** | ~0.45 |
| **Url encode** | ~0.92 |
| **Without the** | ~0.69 |
| **Json format** | ~0.59 |
| **Leetspeak** | ~0.15 |
| **Bad words** | ~0.38 |
### Key Observations
* **Highest Effectiveness:** The "Url encode" and "CoT" (Chain of Thought) methods demonstrate the highest RtA values, both exceeding 0.90. "Programming" also performs very highly at approximately 0.88.
* **Lowest Effectiveness:** "Multitask" and "Leetspeak" are the least effective methods, with RtA values significantly below 0.20.
* **Scale Limitation:** The X-axis is insufficient for the data presented, as the top three performing categories ("Url encode", "CoT", "Programming") extend past the final labeled tick mark of 0.75.
* **Gradient Discrepancy:** The color gradient does not correlate with the data values. For example, "Fixed sentence" (top, dark) has a high value, but "Bad words" (bottom, light) has a low value, yet "Programming" (near the top, dark) is high, while "Multitask" (middle, light) is low. The gradient is purely aesthetic.
### Interpretation
The data suggests this chart measures the **success rate of various jailbreak or prompt injection attacks** against an AI model. "RtA" likely stands for "Rate of Attack" success or "Response to Attack" success.
* **High-Impact Vectors:** Techniques like "Url encode," "CoT" (Chain of Thought), and "Programming" are highly effective at bypassing model constraints. This suggests that the model is particularly vulnerable to structured, logical, or obfuscated inputs that force the model to process information in a way that bypasses standard safety filters.
* **Low-Impact Vectors:** "Multitask" and "Leetspeak" appear to be ineffective. This indicates that the model's safety training is robust against simple character-level obfuscation (Leetspeak) or basic task-switching commands.
* **Strategic Insight:** The high performance of "CoT" and "Programming" suggests that the model struggles to maintain safety alignment when the attack requires complex, multi-step reasoning or code-based execution, as these formats may distract the model from its safety instructions.