## Diagram: Entity and Relation Extraction Process
### Overview
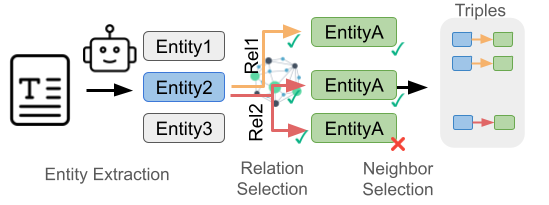
The image illustrates a process for extracting entities and relations from text to form triples. It involves entity extraction, relation selection, and neighbor selection.
### Components/Axes
* **Header:** "Triples" is located at the top-right of the diagram.
* **Stages (Left to Right):**
* Entity Extraction
* Relation Selection
* Neighbor Selection
* **Entities:**
* Entity1 (top, light gray box)
* Entity2 (middle, light blue box)
* Entity3 (bottom, light gray box)
* **Relations:**
* Rel1 (orange arrow)
* Rel2 (red arrow)
* **Neighbor Entities:**
* EntityA (green box, top) - with a green checkmark
* EntityA (green box, middle) - with a green checkmark
* EntityA (green box, bottom) - with a red X mark
* **Input:** A document icon with a large "T" on it.
* **Process Indicators:** Arrows showing the flow of information.
* **Output:** Triples (blue box -> orange/red arrow -> green box)
### Detailed Analysis or Content Details
1. **Entity Extraction:**
* A document icon with a "T" is the input.
* An arrow points from the document to a robot icon, then to three entities: Entity1, Entity2, and Entity3. Entity2 is highlighted in blue.
2. **Relation Selection:**
* Arrows originate from Entity2 to a network graph.
* Rel1 (orange arrow) connects Entity2 to the network graph.
* Rel2 (red arrow) connects Entity2 to the network graph.
3. **Neighbor Selection:**
* The network graph connects to three instances of EntityA.
* The top two EntityA instances have green checkmarks, indicating successful selection.
* The bottom EntityA instance has a red X mark, indicating rejection.
4. **Triples:**
* The selected EntityA instances form triples with Entity2.
* Three triples are shown:
* Entity2 -> Rel1 -> EntityA (blue box -> orange arrow -> green box)
* Entity2 -> Rel1 -> EntityA (blue box -> orange arrow -> green box)
* Entity2 -> Rel2 -> EntityA (blue box -> red arrow -> green box)
### Key Observations
* Entity2 is the central entity for relation extraction.
* The network graph in "Relation Selection" likely represents a knowledge graph or relation database.
* Neighbor Selection filters the potential relations based on some criteria (indicated by the checkmarks and X mark).
### Interpretation
The diagram illustrates a knowledge extraction pipeline. It starts with identifying entities in a text document. Then, it selects relations between these entities using a knowledge graph. Finally, it selects appropriate neighbors (other entities) to form triples, which represent structured knowledge extracted from the text. The checkmarks and X mark suggest a validation or filtering step to ensure the quality of the extracted triples.