## Diagram: Information Extraction Pipeline to Knowledge Triples
### Overview
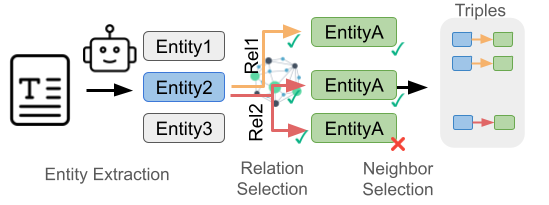
The image is a technical flowchart illustrating a three-stage pipeline for extracting structured knowledge triples from unprocessed text. The process flows from left to right, beginning with a source document and ending with formatted output triples. The diagram uses icons, labeled boxes, colored arrows, and status indicators to depict each step.
### Components/Axes
The diagram is segmented into four distinct functional regions, arranged horizontally:
1. **Input & Entity Extraction (Leftmost Region):**
* **Input Icon:** A document icon labeled with a capital "T" represents the source text.
* **Process Icon:** A robot head icon symbolizes the automated extraction system.
* **Output of Stage:** Three rectangular boxes labeled `Entity1`, `Entity2`, and `Entity3` in a vertical list. `Entity2` is highlighted with a blue background.
2. **Relation Selection (Center-Left Region):**
* **Process:** Arrows originate from the `Entity2` box, indicating it is the subject for relation extraction.
* **Relation Labels:** Two red arrows are labeled `Rel1` (pointing upward) and `Rel2` (pointing downward).
* **Target:** Both arrows point toward a cluster of three green boxes, each labeled `EntityA`. This suggests multiple potential object entities for the relations.
3. **Neighbor Selection (Center-Right Region):**
* **Process:** This stage filters the candidate `EntityA` nodes from the previous step.
* **Status Indicators:** The top two `EntityA` boxes have green checkmarks (✓) next to them, indicating they are valid or selected neighbors. The bottom `EntityA` box has a red cross (✗), indicating it is invalid or rejected.
4. **Triples (Rightmost Region):**
* **Output Container:** A light gray rounded rectangle labeled "Triples" at the top.
* **Output Content:** Inside, three structured triples are displayed vertically. Each triple consists of a blue square (subject), a red arrow (predicate/relation), and a green square (object). This visually represents the final structured output: `(Entity2, Rel1, EntityA)` and `(Entity2, Rel2, EntityA)`.
### Detailed Analysis
* **Flow & Connectivity:** The pipeline is strictly sequential: Document → Entity Extraction → Relation Selection → Neighbor Selection → Triples.
* **Color Coding:**
* **Blue:** Represents the primary subject entity (`Entity2`) and the subject component in the final triples.
* **Green:** Represents candidate and selected object entities (`EntityA`) and the object component in the final triples.
* **Red:** Represents the relations (`Rel1`, `Rel2`) and the predicate component in the final triples.
* **Spatial Grounding:** The legend (color meaning) is implicit but consistent. The `Entity2` box (blue) is the central node in the Relation Selection stage. The `EntityA` boxes (green) are the targets. The final triples in the "Triples" container (far right) precisely mirror the color scheme and logical connections established in the middle stages.
* **Trend/Process Verification:** The diagram does not show numerical trends but a logical process flow. The trend is a transformation from unstructured data (document icon) to a filtered, structured format (triples). The "Neighbor Selection" stage acts as a critical filter, reducing three candidate relations to two valid ones.
### Key Observations
1. **Entity Disambiguation:** The "Neighbor Selection" stage is crucial. It shows that not all extracted relations (`Rel1`, `Rel2` to `EntityA`) are valid. The system performs a validation step, likely using context or knowledge base constraints, to discard incorrect links (the bottom `EntityA` with the ✗).
2. **One-to-Many Relation:** The diagram explicitly shows that a single subject entity (`Entity2`) can have multiple relations (`Rel1`, `Rel2`) pointing to the same object entity type (`EntityA`), resulting in multiple distinct triples.
3. **Abstraction:** The use of generic labels (`Entity1`, `Rel1`) indicates this is a conceptual model of a process, not a specific example with real-world data.
### Interpretation
This diagram models a core task in Natural Language Processing (NLP) and Knowledge Graph construction: **Open Information Extraction**. It demonstrates how a system can:
1. **Identify** entities (`Entity1,2,3`) from raw text.
2. **Hypothesize** potential relationships (`Rel1, Rel2`) between a chosen subject (`Entity2`) and other entities.
3. **Validate** these hypotheses by checking the "neighborhood" or context of the linked entities, filtering out spurious connections.
4. **Output** clean, structured facts in the form of `(subject, predicate, object)` triples, which are the fundamental building blocks of a knowledge graph.
The presence of the "Neighbor Selection" stage is particularly significant. It implies the system goes beyond simple pattern matching and incorporates a verification mechanism—perhaps using semantic similarity, knowledge base coherence, or syntactic constraints—to improve the precision of the extracted knowledge. The final "Triples" are the actionable, machine-readable output that can be used for search, reasoning, or AI training.