# Technical Document Analysis of Chart
## Title
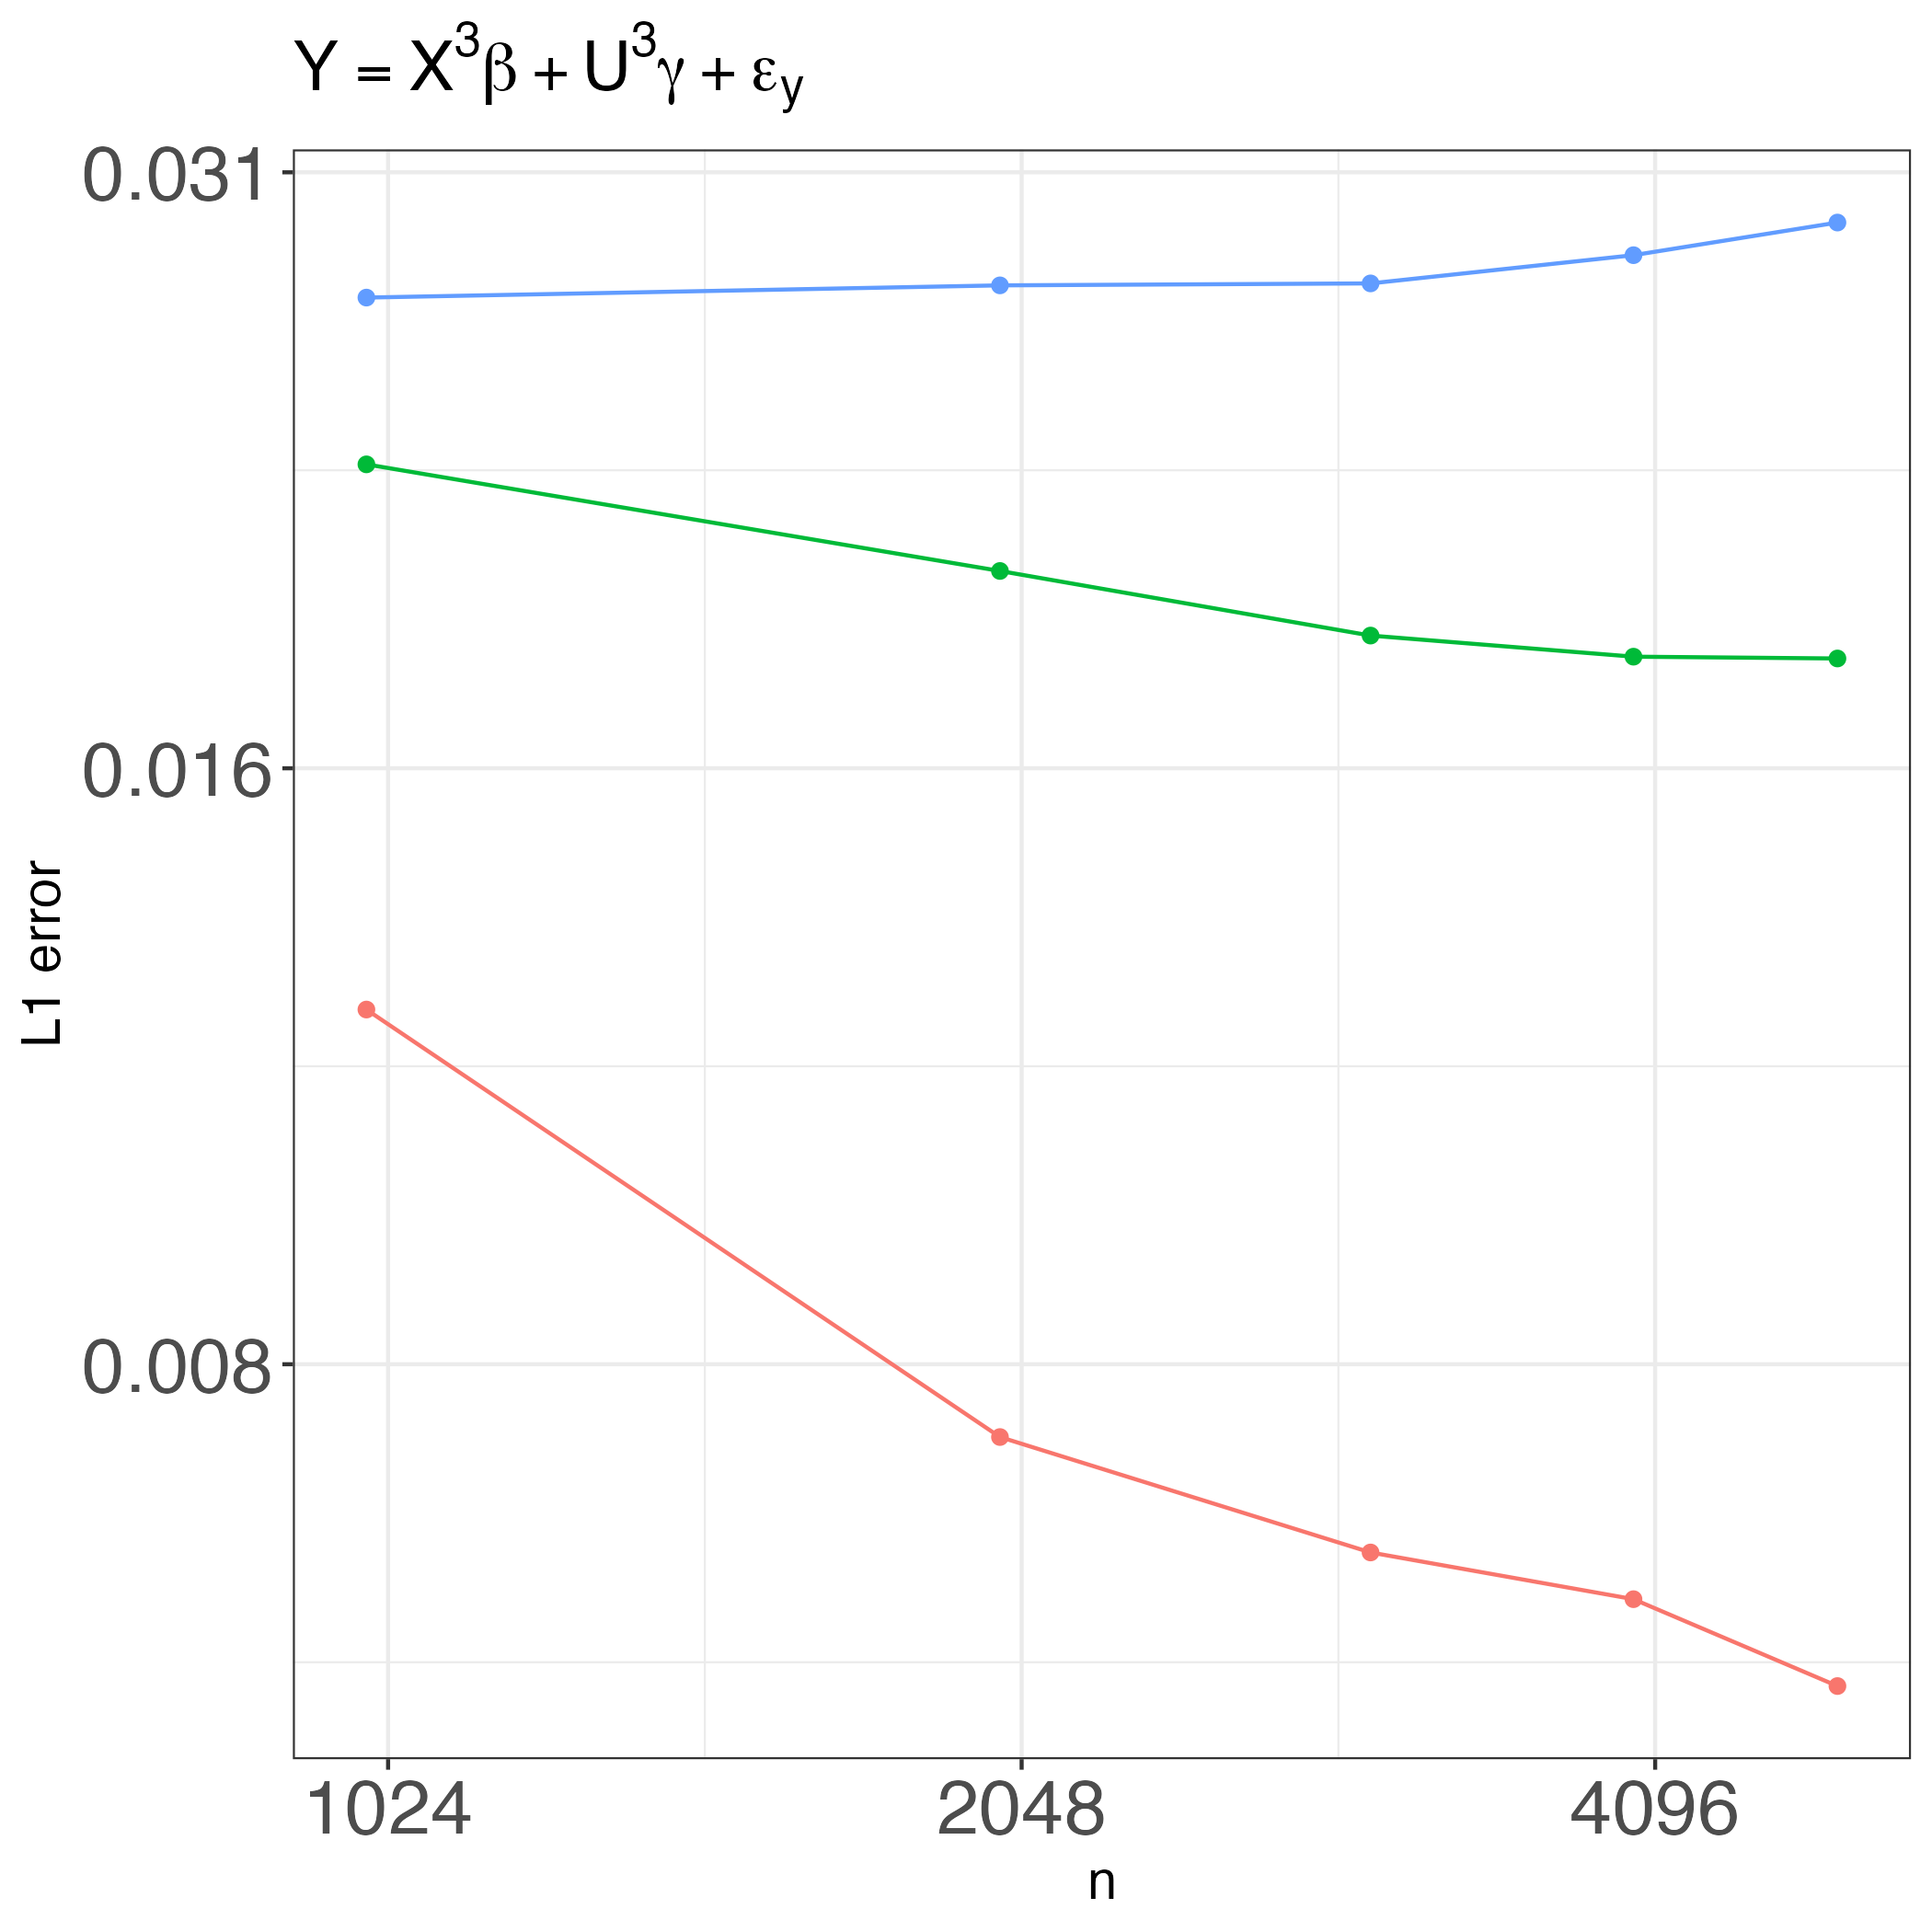
**Y = X³β + U³γ + εy**
## Axes
- **X-axis**: Labeled "n" with values:
- 1024
- 2048
- 4096
- **Y-axis**: Labeled "L1 error" with values:
- 0.008
- 0.016
- 0.024
- 0.031
## Legend
- **Location**: Top-right corner of the chart.
- **Entries**:
- **Blue**: "U³γ + εy"
- **Green**: "X³β"
- **Red**: "εy"
## Data Series
### Blue Line ("U³γ + εy")
- **Trend**: Slight upward slope.
- **Data Points**:
- At n=1024: 0.028
- At n=2048: 0.0285
- At n=4096: 0.030
### Green Line ("X³β")
- **Trend**: Gradual downward slope.
- **Data Points**:
- At n=1024: 0.024
- At n=2048: 0.021
- At n=4096: 0.017
### Red Line ("εy")
- **Trend**: Steep downward slope.
- **Data Points**:
- At n=1024: 0.012
- At n=2048: 0.0075
- At n=4096: 0.006
## Key Observations
1. **Blue Line ("U³γ + εy")**:
- Starts at 0.028 (n=1024) and increases to 0.030 (n=4096).
- Represents the highest error values across all n.
2. **Green Line ("X³β")**:
- Decreases from 0.024 (n=1024) to 0.017 (n=4096).
- Shows a consistent reduction in error as n increases.
3. **Red Line ("εy")**:
- Drops sharply from 0.012 (n=1024) to 0.006 (n=4096).
- Demonstrates the most significant error reduction.
## Data Table
| n | U³γ + εy (Blue) | X³β (Green) | εy (Red) |
|--------|------------------|-------------|----------|
| 1024 | 0.028 | 0.024 | 0.012 |
| 2048 | 0.0285 | 0.021 | 0.0075 |
| 4096 | 0.030 | 0.017 | 0.006 |
## Notes
- **Language**: All text is in English.
- **Legend Accuracy**: Colors and labels match the corresponding lines.
- **Spatial Grounding**:
- Legend is positioned at the top-right.
- Data points align with their respective lines and legend entries.
- **Trend Verification**:
- Blue line slopes upward (confirmed by increasing y-values).
- Green and red lines slope downward (confirmed by decreasing y-values).
This chart illustrates the relationship between the variable `n` and the L1 error for three distinct mathematical components of the equation `Y = X³β + U³γ + εy`. The red line ("εy") shows the most significant error reduction, while the blue line ("U³γ + εy") exhibits the least change.