## Radar Chart: Reward Model Comparison
### Overview
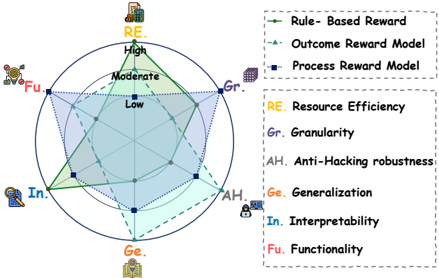
The image presents a radar chart comparing three reward models: Rule-Based Reward, Outcome Reward Model, and Process Reward Model. The chart assesses these models across six criteria: Resource Efficiency, Granularity, Anti-Hacking Robustness, Generalization, Interpretability, and Functionality. The chart uses three concentric circles to represent "Low", "Moderate", and "High" levels for each criterion.
### Components/Axes
* **Axes:** The radar chart has six axes radiating from the center, each representing a different criterion.
* RE: Resource Efficiency (located at the top)
* Gr: Granularity (located at the top-right)
* AH: Anti-Hacking Robustness (located at the bottom-right)
* Ge: Generalization (located at the bottom)
* In: Interpretability (located at the bottom-left)
* Fu: Functionality (located at the top-left)
* **Scale:** The chart uses three concentric circles to indicate the level of each criterion:
* Innermost circle: Low
* Middle circle: Moderate
* Outermost circle: High
* **Legend:** Located on the right side of the chart.
* Green solid line: Rule-Based Reward
* Light blue dashed line: Outcome Reward Model
* Dark blue dotted line: Process Reward Model
### Detailed Analysis
* **Rule-Based Reward (Green solid line):**
* Resource Efficiency: High
* Granularity: High
* Anti-Hacking Robustness: Moderate
* Generalization: Low
* Interpretability: High
* Functionality: High
* **Outcome Reward Model (Light blue dashed line):**
* Resource Efficiency: Moderate
* Granularity: Moderate
* Anti-Hacking Robustness: Low
* Generalization: Moderate
* Interpretability: Moderate
* Functionality: Moderate
* **Process Reward Model (Dark blue dotted line):**
* Resource Efficiency: Moderate
* Granularity: Moderate
* Anti-Hacking Robustness: Moderate
* Generalization: Moderate
* Interpretability: Moderate
* Functionality: Moderate
### Key Observations
* The Rule-Based Reward model excels in Resource Efficiency, Granularity, Interpretability, and Functionality, but it is weak in Generalization.
* The Outcome Reward Model and Process Reward Model have similar profiles, with moderate performance across all criteria.
* The Rule-Based Reward model has the most variance in its scores, while the other two models are more consistent.
### Interpretation
The radar chart provides a visual comparison of the strengths and weaknesses of three different reward models. The Rule-Based Reward model appears to be a strong choice when Resource Efficiency, Granularity, Interpretability, and Functionality are prioritized, but its poor Generalization may be a significant drawback in some applications. The Outcome Reward Model and Process Reward Model offer a more balanced performance across all criteria, making them potentially suitable when a consistent level of performance is desired. The chart highlights the trade-offs involved in selecting a reward model, allowing decision-makers to choose the model that best aligns with their specific needs and priorities.