\n
## Radar Chart: Multi-Criteria Performance Comparison
### Overview
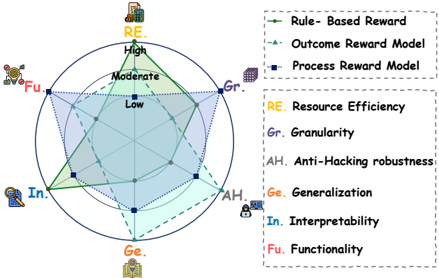
The image presents a radar chart (also known as a spider chart or star chart) comparing the performance of three different reward models – Rule-Based Reward, Outcome Reward Model, and Process Reward Model – across six criteria: Resource Efficiency (RE), Granularity (Gr), Anti-Hacking robustness (AH), Generalization (Ge), Interpretability (In), and Functionality (Fu). The chart uses a star-shaped polygon to visualize the performance of each model, with each vertex representing a criterion. The further a point is from the center, the higher the performance on that criterion.
### Components/Axes
* **Axes/Criteria:** The six criteria are arranged radially around the center of the chart. They are:
* Resource Efficiency (RE) - Yellow
* Granularity (Gr) - Purple
* Anti-Hacking robustness (AH) - Pink
* Generalization (Ge) - Teal
* Interpretability (In) - Blue
* Functionality (Fu) - Red
* **Legend:** Located in the top-right corner and bottom-right corner of the image, the legend maps colors to reward models:
* Green Dashed Line: Rule-Based Reward
* Blue Dashed Line: Outcome Reward Model
* Navy Blue Dotted Line: Process Reward Model
* **Radial Scale:** Concentric circles indicate performance levels: Low, Moderate, High.
* **Icons:** Small icons are placed near each criterion label, visually representing the concept.
### Detailed Analysis
The chart displays three polygonal lines, each representing a reward model.
* **Rule-Based Reward (Green Dashed Line):**
* RE: Approximately High (near the outer circle).
* Gr: Approximately Moderate (midway between the center and outer circle).
* AH: Approximately Low (close to the center).
* Ge: Approximately Moderate (midway between the center and outer circle).
* In: Approximately High (near the outer circle).
* Fu: Approximately Moderate (midway between the center and outer circle).
* Trend: The line fluctuates, showing strong performance in RE and In, but weaker performance in AH.
* **Outcome Reward Model (Blue Dashed Line):**
* RE: Approximately Low (close to the center).
* Gr: Approximately High (near the outer circle).
* AH: Approximately Moderate (midway between the center and outer circle).
* Ge: Approximately Low (close to the center).
* In: Approximately Moderate (midway between the center and outer circle).
* Fu: Approximately Moderate (midway between the center and outer circle).
* Trend: The line shows a peak in Gr, but generally remains closer to the center, indicating lower overall performance.
* **Process Reward Model (Navy Blue Dotted Line):**
* RE: Approximately Moderate (midway between the center and outer circle).
* Gr: Approximately Moderate (midway between the center and outer circle).
* AH: Approximately High (near the outer circle).
* Ge: Approximately Moderate (midway between the center and outer circle).
* In: Approximately Low (close to the center).
* Fu: Approximately Moderate (midway between the center and outer circle).
* Trend: The line shows a peak in AH, but lower performance in In.
### Key Observations
* The Rule-Based Reward model excels in Resource Efficiency and Interpretability.
* The Outcome Reward Model is strongest in Granularity.
* The Process Reward Model demonstrates the highest Anti-Hacking robustness.
* No single model dominates across all criteria; each has its strengths and weaknesses.
* Interpretability (In) is a relative weakness for the Process Reward Model.
* Generalization (Ge) is a relative weakness for the Outcome Reward Model.
### Interpretation
This radar chart provides a comparative assessment of three reward models based on six key performance indicators. The visualization highlights the trade-offs inherent in each model. For example, the Rule-Based Reward model offers high Resource Efficiency and Interpretability but is vulnerable to hacking. Conversely, the Process Reward Model prioritizes security (Anti-Hacking robustness) at the expense of Interpretability.
The chart suggests that the optimal choice of reward model depends on the specific application and the relative importance of each criterion. If security is paramount, the Process Reward Model is the best choice. If resource efficiency and ease of understanding are critical, the Rule-Based Reward model is preferable. The Outcome Reward Model is best suited for applications where fine-grained control (Granularity) is essential.
The use of a radar chart effectively communicates these complex relationships, allowing for a quick and intuitive understanding of the strengths and weaknesses of each model. The concentric circles provide a clear visual indication of performance levels, and the color-coding facilitates easy comparison.