\n
## Radar Chart: Reward Model Comparison
### Overview
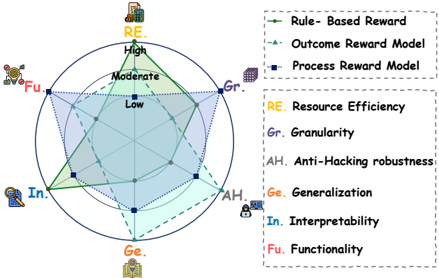
The image displays a radar chart (spider chart) comparing the performance of three different reward models across six evaluation criteria. The chart uses a circular layout with six axes radiating from the center, each representing a specific criterion. The three models are distinguished by different line styles and colors, as defined in the legend.
### Components/Axes
* **Chart Type:** Radar Chart (Spider Plot)
* **Axes (6):** Each axis represents a criterion, labeled with an abbreviation and a corresponding icon. The axes are arranged clockwise from the top:
1. **RE** (Top, icon: a server rack) - **Resource Efficiency**
2. **Gr.** (Top-right, icon: a stack of blocks) - **Granularity**
3. **AH** (Bottom-right, icon: a padlock) - **Anti-Hacking robustness**
4. **Ge.** (Bottom, icon: a branching network) - **Generalization**
5. **In.** (Bottom-left, icon: a magnifying glass over a document) - **Interpretability**
6. **Fu** (Top-left, icon: a gear) - **Functionality**
* **Scale:** Each axis has three concentric rings indicating performance levels: **Low** (innermost), **Moderate** (middle), and **High** (outermost).
* **Legend (Top-Right):**
* **Rule-Based Reward:** Represented by a **solid green line** with circular markers.
* **Outcome Reward Model:** Represented by a **dashed blue line** with triangular markers.
* **Process Reward Model:** Represented by a **dotted purple line** with square markers.
* **Criterion Definitions (Right Side):** A text box explicitly defines the abbreviations used on the axes.
### Detailed Analysis
The performance of each model is plotted as a polygon connecting its score on each of the six axes.
**1. Rule-Based Reward (Green, Solid Line)**
* **Trend:** This model shows a strong bias towards operational metrics, scoring highest on the axes related to implementation and output.
* **Data Points:**
* **RE (Resource Efficiency):** **High** (Outermost ring)
* **Gr. (Granularity):** **Moderate** (Middle ring)
* **AH (Anti-Hacking robustness):** **Low** (Innermost ring)
* **Ge. (Generalization):** **Low** (Innermost ring)
* **In. (Interpretability):** **Moderate** (Middle ring)
* **Fu (Functionality):** **High** (Outermost ring)
**2. Outcome Reward Model (Blue, Dashed Line)**
* **Trend:** This model's profile is skewed towards security and detail, with a notable weakness in transparency and core function.
* **Data Points:**
* **RE (Resource Efficiency):** **Moderate** (Middle ring)
* **Gr. (Granularity):** **High** (Outermost ring)
* **AH (Anti-Hacking robustness):** **High** (Outermost ring)
* **Ge. (Generalization):** **Moderate** (Middle ring)
* **In. (Interpretability):** **Low** (Innermost ring)
* **Fu (Functionality):** **Low** (Innermost ring)
**3. Process Reward Model (Purple, Dotted Line)**
* **Trend:** This model excels in adaptive and understandable qualities but is the least effective in terms of fine-grained control and basic utility.
* **Data Points:**
* **RE (Resource Efficiency):** **Moderate** (Middle ring)
* **Gr. (Granularity):** **Low** (Innermost ring)
* **AH (Anti-Hacking robustness):** **Moderate** (Middle ring)
* **Ge. (Generalization):** **High** (Outermost ring)
* **In. (Interpretability):** **High** (Outermost ring)
* **Fu (Functionality):** **Low** (Innermost ring)
### Key Observations
* **Complementary Strengths:** The three models have almost perfectly complementary profiles. Where one is strong, another is typically weak. For example, the Rule-Based model's strength in **Functionality** is the Outcome and Process models' weakness. Conversely, the Process model's strength in **Interpretability** is the Outcome model's weakness.
* **No Dominant Model:** No single model achieves a "High" score on more than two criteria. Each model has a distinct specialization.
* **Trade-off Patterns:** There appears to be a visual trade-off between **Granularity** and **Interpretability** (Outcome vs. Process models) and between **Functionality** and **Generalization** (Rule-Based vs. Process models).
### Interpretation
This radar chart visually argues that the choice of reward model involves significant trade-offs, and the "best" model depends entirely on the prioritized criteria for a given application.
* **Rule-Based Reward** is the pragmatic choice for controlled environments where **Resource Efficiency** and core **Functionality** are paramount, and where the risks of hacking or the need for complex generalization are low. Its moderate **Interpretability** suggests it is somewhat transparent.
* **Outcome Reward Model** is suited for high-stakes, adversarial environments where **Anti-Hacking robustness** and fine-grained evaluation (**Granularity**) are critical. However, its low **Interpretability** and **Functionality** scores indicate it may be a "black box" that is difficult to understand and may not directly drive the desired behaviors.
* **Process Reward Model** is the candidate for dynamic, open-ended tasks requiring **Generalization** to new situations and where **Interpretability** (understanding *why* a decision was made) is essential. Its poor scores on **Granularity** and **Functionality** imply it may be too abstract or high-level for precise control.
The chart effectively communicates that advancing in one dimension (e.g., making a model more robust or interpretable) often comes at the cost of another (e.g., making it less functional or efficient). This is a classic engineering and design dilemma, and the visualization makes these complex relationships immediately apparent.