## Radar Chart: Performance Metrics of Reward Models
### Overview
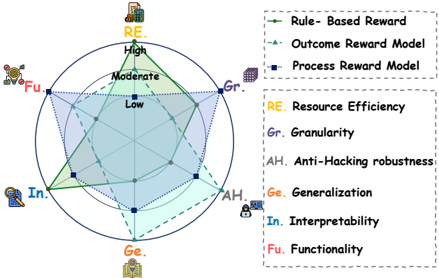
The image is a radar chart comparing three reward models (Rule-Based Reward, Outcome Reward Model, Process Reward Model) across five performance metrics: Resource Efficiency (RE), Granularity (Gr), Anti-Hacking robustness (AH), Interpretability (In), and Functionality (Fu). The chart uses color-coded lines and markers to represent each model, with axes arranged in a circular layout. Data points are plotted with qualitative labels (High, Moderate, Low) rather than numerical values.
### Components/Axes
- **Axes**:
- **RE**: Resource Efficiency (icon: document)
- **Gr**: Granularity (icon: cube)
- **AH**: Anti-Hacking robustness (icon: shield)
- **In**: Interpretability (icon: magnifying glass)
- **Fu**: Functionality (icon: gear)
- **Legend**:
- **Rule-Based Reward**: Green solid line
- **Outcome Reward Model**: Blue dashed line
- **Process Reward Model**: Blue square markers
- **Positioning**:
- Legend is located in the top-right quadrant.
- Axes are evenly spaced around the circle, starting with RE at the top and proceeding clockwise.
### Detailed Analysis
- **Rule-Based Reward (Green Line)**:
- **RE**: High (topmost point on the RE axis)
- **Gr**: Moderate (midpoint on the Gr axis)
- **AH**: Moderate (midpoint on the AH axis)
- **In**: High (topmost point on the In axis)
- **Fu**: Low (bottommost point on the Fu axis)
- **Outcome Reward Model (Blue Dashed Line)**:
- **RE**: Moderate (midpoint on the RE axis)
- **Gr**: High (topmost point on the Gr axis)
- **AH**: Moderate (midpoint on the AH axis)
- **In**: Low (bottommost point on the In axis)
- **Fu**: Moderate (midpoint on the Fu axis)
- **Process Reward Model (Blue Square Markers)**:
- **RE**: Low (bottommost point on the RE axis)
- **Gr**: Moderate (midpoint on the Gr axis)
- **AH**: High (topmost point on the AH axis)
- **In**: Moderate (midpoint on the In axis)
- **Fu**: Low (bottommost point on the Fu axis)
### Key Observations
1. **Rule-Based Reward** excels in **Resource Efficiency** and **Interpretability** but struggles with **Functionality**.
2. **Outcome Reward Model** performs best in **Granularity** but has the lowest score in **Interpretability**.
3. **Process Reward Model** achieves the highest **Anti-Hacking robustness** but has the lowest **Resource Efficiency** and **Functionality**.
4. All models show **Moderate** performance in **Granularity** and **Anti-Hacking robustness**, suggesting these metrics are less differentiated.
### Interpretation
The chart highlights trade-offs between reward models across critical metrics. The **Rule-Based Reward** prioritizes efficiency and interpretability but sacrifices functionality, making it suitable for systems where transparency and resource optimization are paramount. The **Outcome Reward Model** emphasizes granularity but lacks interpretability, potentially limiting its use in scenarios requiring human oversight. The **Process Reward Model** focuses on security (anti-hacking) but underperforms in efficiency and functionality, indicating a specialization in robustness at the cost of other attributes. These patterns suggest that no single model dominates across all metrics, necessitating context-specific choices based on system requirements.