\n
## Diagram: Research Process - Paper Identification
### Overview
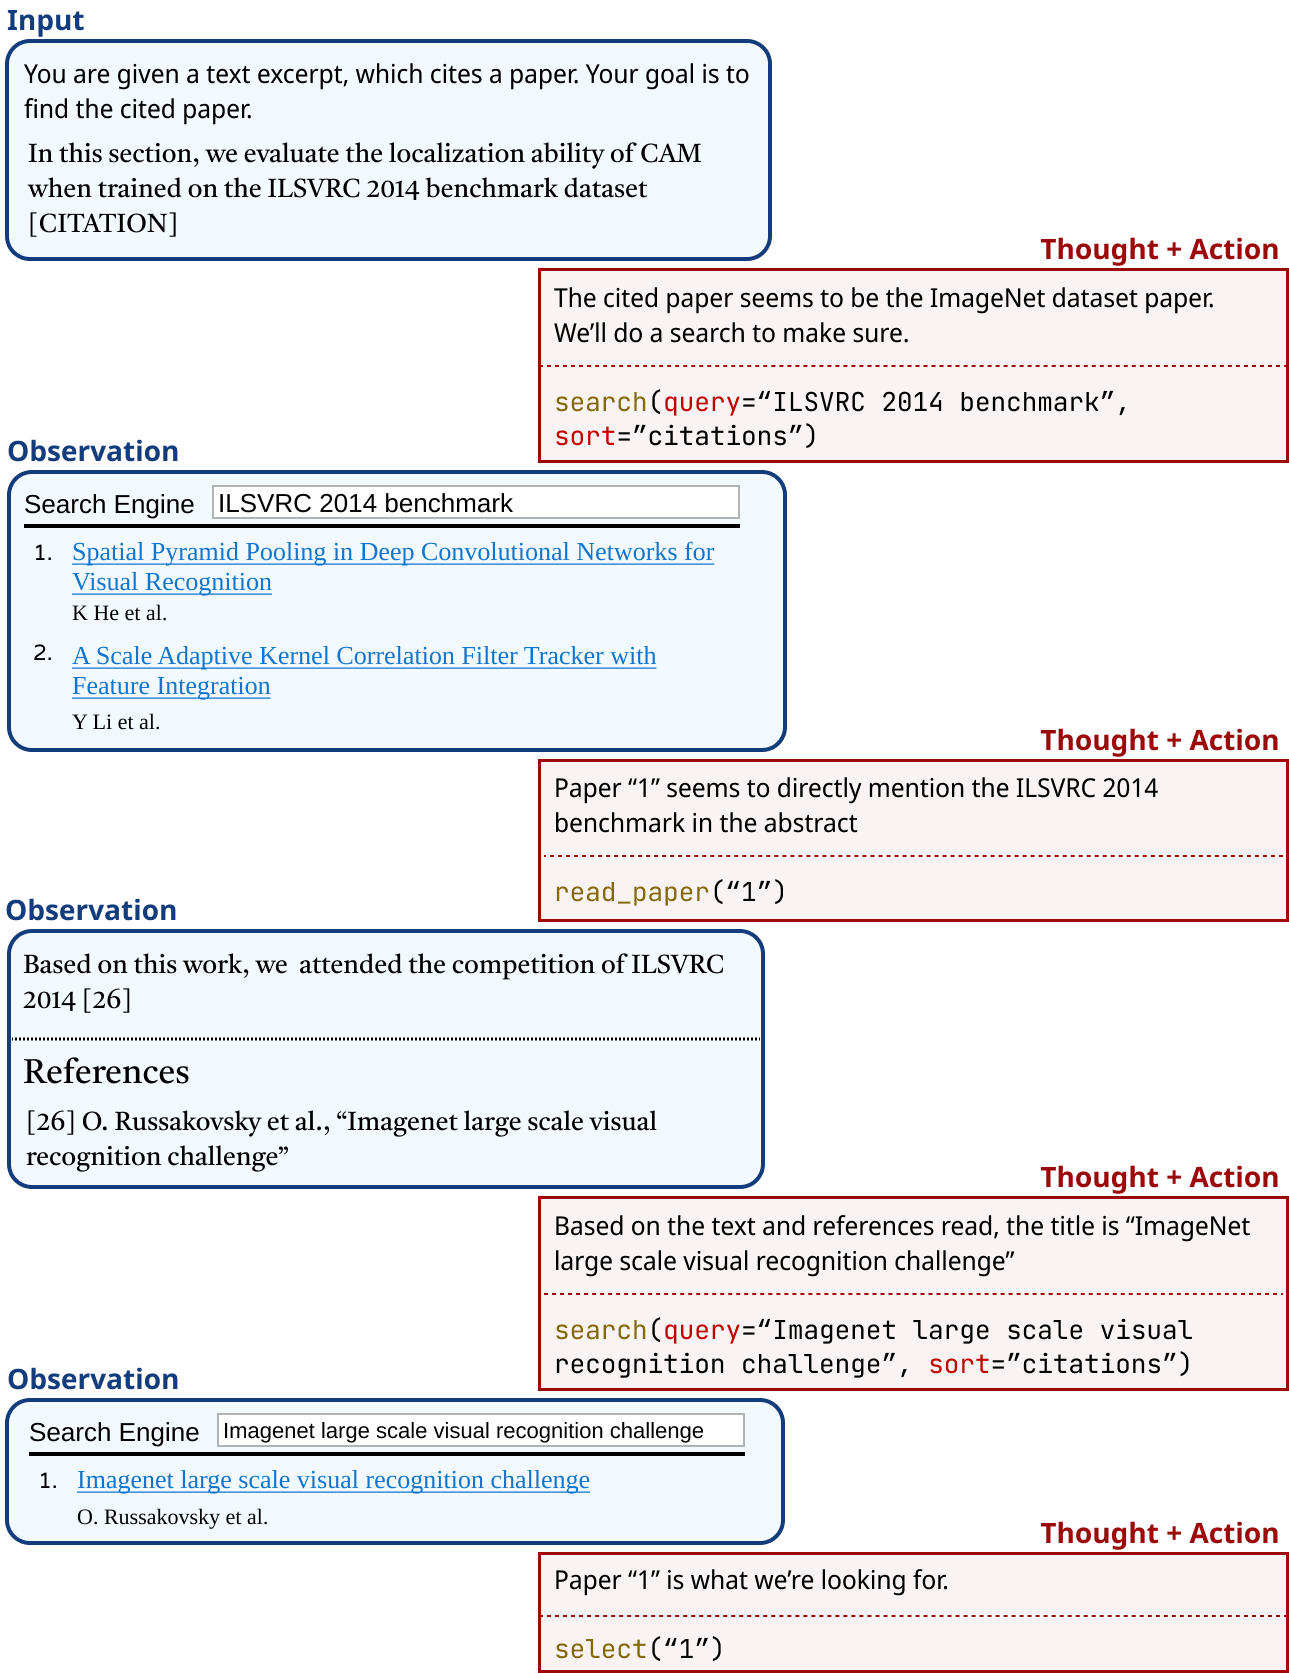
This diagram depicts a research process focused on identifying a cited paper. It shows a sequence of observations, search engine queries, and actions taken to locate the paper referenced in an initial text excerpt. The process is visually represented as a series of blocks with text and simulated search engine results.
### Components/Axes
The diagram is structured into distinct blocks representing:
* **Input:** The initial text excerpt.
* **Observation:** Researcher's notes based on the input.
* **Search Engine:** Simulated search engine interface displaying results.
* **Thought + Action:** Actions taken by the researcher based on observations and search results.
* **References:** List of references.
There are no explicit axes in this diagram. The flow is primarily top-to-bottom.
### Detailed Analysis or Content Details
**1. Input Block:**
* Text: "In this section, we evaluate the localization ability of CAM when trained on the ILSVRC 2014 benchmark dataset [CITATION]"
**2. First Observation Block:**
* Text: "The cited paper seems to be the ImageNet dataset paper. We’ll do a search to make sure."
**3. First Search Engine Block:**
* Query: "ILSVRC 2014 benchmark"
* Sort: "citations"
* Results:
1. "Spatial Pyramid Pooling in Deep Convolutional Networks for Visual Recognition" - K He et al.
2. "A Scale Adaptive Kernel Correlation Filter Tracker with Feature Integration" - Y Li et al.
**4. First Thought + Action Block:**
* Text: "Paper “1” seems to directly mention the ILSVRC 2014 benchmark in the abstract"
* Action: "read\_paper(“1”)"
**5. Second Observation Block:**
* Text: "Based on this work, we attended the competition of ILSVRC 2014 [26]"
**6. References Block:**
* "[26] O. Russakovsky et al., “Imagenet large scale visual recognition challenge”"
**7. Second Search Engine Block:**
* Query: "Imagenet large scale visual recognition challenge"
* Results:
1. "Imagenet large scale visual recognition challenge" - O. Russakovsky et al.
**8. Second Thought + Action Block:**
* Text: "Based on the text and references read, the title is “Imagenet large scale visual recognition challenge”"
* Action: "search(query=“Imagenet large scale visual recognition challenge”, sort=“citations”)"
* Action: "select(“1”)"
### Key Observations
* The process is iterative, involving observation, search, and refinement.
* The researcher uses the initial citation context ("ILSVRC 2014 benchmark") to narrow down the search.
* The search results are sorted by citations, suggesting a focus on influential papers.
* The researcher uses both the title and authors to confirm the correct paper.
* The diagram simulates a real-world research workflow.
### Interpretation
This diagram illustrates a common research methodology: starting with a citation, identifying potential candidate papers through search engines, and iteratively refining the search based on observations and available information. The use of "Thought + Action" blocks highlights the cognitive process involved in research, where observations lead to specific actions. The sorting by "citations" indicates a preference for well-regarded and impactful publications. The diagram effectively demonstrates how a researcher can navigate the vast landscape of academic literature to locate a specific paper based on limited initial information. The diagram is not presenting data, but rather a process. It's a visual representation of a workflow. The diagram's value lies in its clarity and its ability to convey a complex process in a concise and understandable manner.