## Diagram: BAGEL Model Architecture
### Overview
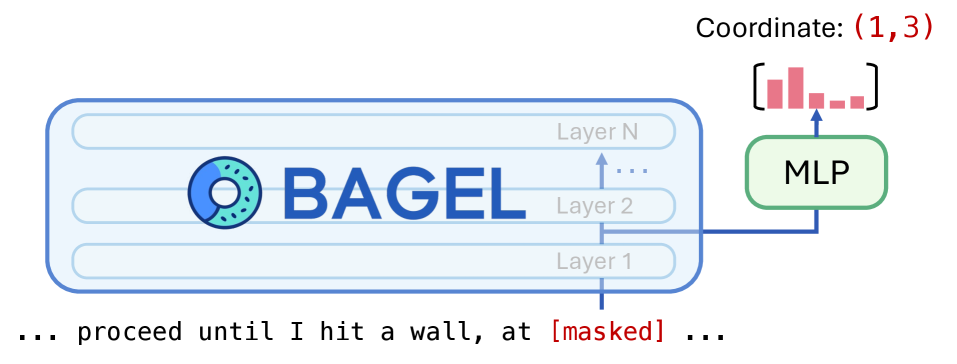
The image presents a diagram illustrating the architecture of a model named "BAGEL." It shows the flow of information through different layers of the model, culminating in an output processed by an MLP (Multi-Layer Perceptron). The diagram also includes a text snippet indicating the context of the model's operation.
### Components/Axes
* **BAGEL:** The name of the model, prominently displayed. A logo of a donut is to the left of the name.
* **Layers:** The model consists of multiple layers, labeled as "Layer 1," "Layer 2," and "Layer N."
* **MLP:** A green rounded rectangle labeled "MLP" (Multi-Layer Perceptron), representing a processing unit.
* **Coordinate:** Text at the top-right corner, "Coordinate: (1,3)" in red.
* **Bar Graph:** A small bar graph above the MLP, with several bars of varying heights, enclosed in square brackets. The bars are pink.
* **Text Snippet:** A text snippet at the bottom: "... proceed until I hit a wall, at [masked] ...". The word "[masked]" is in red.
* **Arrows:** Arrows indicate the flow of information between layers and to the MLP.
### Detailed Analysis
* **Layer Structure:** The layers are arranged vertically, with "Layer 1" at the bottom and "Layer N" at the top. An arrow points upwards from Layer 1. An arrow points upwards from Layer 2 to Layer N, with three dots in the middle.
* **MLP Connection:** A blue line connects "Layer 1" to the "MLP." Another blue line connects the "MLP" to "Layer 2."
* **Output:** An arrow points upwards from the "MLP" to the bar graph.
* **Bar Graph Details:** The bar graph consists of approximately 7 bars. The heights of the bars decrease from left to right.
* **Coordinate:** The coordinate (1,3) is written in red.
### Key Observations
* The diagram highlights a multi-layered architecture with connections between layers and an MLP.
* The bar graph likely represents the output distribution or some other relevant metric.
* The text snippet provides context, suggesting a sequence processing task where the model operates until a specific condition is met.
### Interpretation
The diagram illustrates the architecture and flow of information within the BAGEL model. The model processes input through multiple layers, with the output of Layer 1 and Layer 2 being fed into an MLP. The MLP then generates an output, represented by the bar graph, which could be a probability distribution or some other relevant metric. The text snippet suggests that the model is used in a sequence processing task, where it operates until a specific condition (hitting a wall) is met, and a certain element is masked. The coordinate (1,3) likely refers to a specific location or index within the model's processing.