\n
## Diagram: BAGEL Architecture Illustration
### Overview
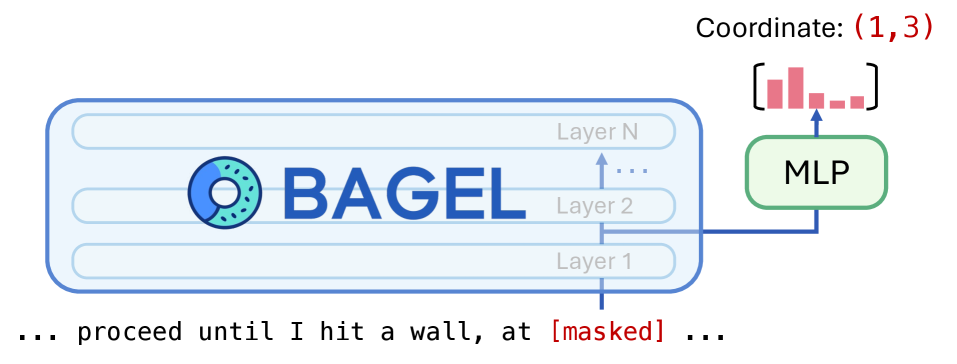
The image depicts a simplified diagram of the BAGEL (presumably a model or system) architecture. It shows a layered structure labeled "Layer 1" through "Layer N" with the text "BAGEL" prominently displayed within the layers. An MLP (Multi-Layer Perceptron) is connected to the output of the layers, and a coordinate is indicated in the top-right corner. There is also a text snippet at the bottom.
### Components/Axes
* **Layers:** Layer 1, Layer 2, Layer N (representing the depth of the BAGEL model).
* **MLP:** Multi-Layer Perceptron, a component receiving input from the BAGEL layers.
* **Coordinate:** (1, 3) - likely representing a position or index within the system.
* **Text Snippet:** "... proceed until I hit a wall, at [masked] ..."
* **Visual Elements:** A bagel icon is present within the layers.
### Detailed Analysis or Content Details
The diagram shows a flow of information from the BAGEL layers to the MLP.
* **BAGEL Layers:** The layers are stacked vertically, with "Layer 1" at the bottom and "Layer N" at the top. An ellipsis ("...") indicates that there are layers between Layer 2 and Layer N.
* **MLP Connection:** An arrow originates from the top-most layer (Layer N) and connects to the MLP.
* **Coordinate:** The coordinate (1, 3) is positioned in the top-right corner.
* **Output Representation:** A red bar graph-like structure is shown above the MLP, potentially representing the output of the MLP. The graph has 5 bars of varying heights.
* **Text Snippet:** The text snippet at the bottom reads "... proceed until I hit a wall, at [masked] ...". The "[masked]" portion suggests that some information is intentionally hidden or omitted.
### Key Observations
* The diagram is highly conceptual and doesn't provide specific numerical data.
* The "BAGEL" name is visually emphasized.
* The coordinate (1, 3) might relate to the location of a specific element or feature within the BAGEL model.
* The masked text suggests a limitation or stopping point in a process.
### Interpretation
The diagram illustrates a high-level architecture where the BAGEL model processes information through multiple layers, and the output of these layers is then fed into an MLP. The MLP likely performs further processing or classification. The coordinate (1, 3) could indicate a specific location or feature within the BAGEL model that is being highlighted. The text snippet suggests a process that continues until a certain condition is met ("hitting a wall"), but the specific condition is obscured by the "[masked]" token.
The presence of the bagel icon within the layers is likely a branding element or a playful reference to the model's name. The diagram is intended to provide a conceptual understanding of the BAGEL architecture rather than a detailed technical specification. The red bar graph above the MLP could represent the output distribution or activation values of the MLP.