## Diagram: Simple Bayesian Network
### Overview
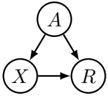
The image depicts a simple Bayesian network consisting of three nodes labeled A, X, and R, connected by directed edges (arrows). The network illustrates probabilistic dependencies between these variables.
### Components/Axes
* **Nodes:**
* A: Top node.
* X: Bottom-left node.
* R: Bottom-right node.
* **Edges (Arrows):**
* A -> X: Directed edge from A to X.
* A -> R: Directed edge from A to R.
* X -> R: Directed edge from X to R.
### Detailed Analysis
The diagram shows the following dependencies:
* Variable X is directly influenced by variable A.
* Variable R is directly influenced by both variables A and X.
### Key Observations
The network structure indicates that A is a parent node to both X and R, and X is also a parent node to R. This implies that the value of R depends on the values of both A and X, while the value of X depends only on the value of A.
### Interpretation
This Bayesian network represents a probabilistic model where the value of variable A influences the values of variables X and R. Additionally, the value of variable X also influences the value of variable R. This type of diagram is used to visualize and reason about probabilistic relationships between variables in various fields such as machine learning, statistics, and decision-making.