## Directed Graph Diagram: Component Relationships
### Overview
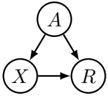
The image depicts a simple directed graph with three nodes labeled **A**, **X**, and **R**. Arrows indicate directional relationships between the nodes. No numerical data, scales, or legends are present.
### Components/Axes
- **Nodes**:
- **A** (top position)
- **X** (bottom-left position)
- **R** (bottom-right position)
- **Edges**:
- **A → X**: Arrow from A to X
- **A → R**: Arrow from A to R
- **X → R**: Arrow from X to R
- **No axis titles, legends, or numerical values** are visible.
### Detailed Analysis
- **Node Placement**:
- **A** is centrally positioned at the top.
- **X** and **R** are symmetrically placed at the bottom, with **X** on the left and **R** on the right.
- **Edge Directions**:
- All arrows originate from **A** (to **X** and **R**) and one arrow originates from **X** (to **R**).
- No bidirectional or self-referential edges are present.
### Key Observations
1. **A** acts as a source node, influencing both **X** and **R**.
2. **X** serves as an intermediate node, transmitting influence to **R**.
3. **R** is a terminal node with no outgoing edges.
4. The graph forms a **directed acyclic graph (DAG)** with no cycles.
### Interpretation
This diagram likely represents a causal or dependency relationship:
- **A** could symbolize an initial event, condition, or input.
- **X** and **R** may represent downstream processes or outcomes.
- The edge **X → R** suggests that **X** directly contributes to or enables **R**, while **A** independently influences both.
- The absence of feedback loops (e.g., no edge from **R** to **A** or **X**) implies a unidirectional flow of influence.
### Notes
- No numerical data or quantitative trends are present; the diagram focuses on structural relationships.
- The simplicity of the graph suggests it may model a foundational concept (e.g., a decision tree, workflow, or logical dependency).