## Chart Type: Comparative Line Plots
### Overview
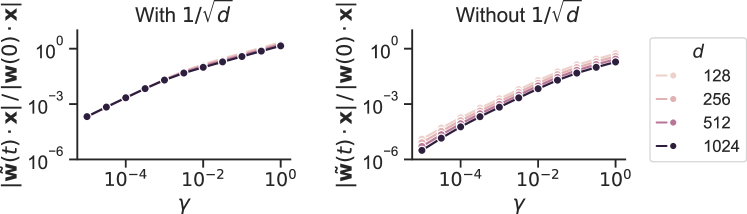
The image presents two line plots comparing the behavior of a system "With 1/√d" and "Without 1/√d". Both plots show the relationship between γ (gamma) on the x-axis and |ŵ(t)⋅x|/|ŵ(0)⋅x| on the y-axis. The plots display data for different values of 'd' (128, 256, 512, and 1024), represented by different colored lines. The x and y axes are logarithmically scaled.
### Components/Axes
* **Titles:**
* Left Plot: "With 1/√d"
* Right Plot: "Without 1/√d"
* **Y-axis (both plots):** |ŵ(t)⋅x|/|ŵ(0)⋅x|
* Scale: Logarithmic, ranging from 10⁻⁶ to 10⁰
* **X-axis (both plots):** γ (gamma)
* Scale: Logarithmic, ranging from 10⁻⁴ to 10⁰
* **Legend (right of the right plot):**
* d = 128 (light gray-pink)
* d = 256 (pink)
* d = 512 (purple-pink)
* d = 1024 (black)
### Detailed Analysis
**Left Plot (With 1/√d):**
* **d = 128 (light gray-pink):** The line starts at approximately (10⁻⁴, 10⁻³) and increases to approximately (10⁰, 10⁰).
* **d = 256 (pink):** The line starts at approximately (10⁻⁴, 10⁻³) and increases to approximately (10⁰, 10⁰).
* **d = 512 (purple-pink):** The line starts at approximately (10⁻⁴, 10⁻³) and increases to approximately (10⁰, 10⁰).
* **d = 1024 (black):** The line starts at approximately (10⁻⁴, 10⁻³) and increases to approximately (10⁰, 10⁰).
**Trend (Left Plot):** All lines exhibit a similar upward trend, indicating that as γ increases, the value of |ŵ(t)⋅x|/|ŵ(0)⋅x| also increases. The lines are very close to each other.
**Right Plot (Without 1/√d):**
* **d = 128 (light gray-pink):** The line starts at approximately (10⁻⁴, 10⁻⁶) and increases to approximately (10⁰, 10⁰).
* **d = 256 (pink):** The line starts at approximately (10⁻⁴, 10⁻⁵) and increases to approximately (10⁰, 10⁰).
* **d = 512 (purple-pink):** The line starts at approximately (10⁻⁴, 10⁻⁴) and increases to approximately (10⁰, 10⁰).
* **d = 1024 (black):** The line starts at approximately (10⁻⁴, 10⁻³) and increases to approximately (10⁰, 10⁰).
**Trend (Right Plot):** All lines exhibit a similar upward trend, indicating that as γ increases, the value of |ŵ(t)⋅x|/|ŵ(0)⋅x| also increases. The lines are more separated than in the left plot.
### Key Observations
* The y-axis values in the "Without 1/√d" plot start at lower values compared to the "With 1/√d" plot, especially for lower values of 'd'.
* In both plots, the lines converge as γ approaches 10⁰.
* The lines for different 'd' values are more distinct in the "Without 1/√d" plot, especially at lower γ values.
### Interpretation
The plots illustrate the impact of including or excluding a factor of 1/√d on the relationship between γ and the ratio |ŵ(t)⋅x|/|ŵ(0)⋅x| for different values of 'd'. The "Without 1/√d" plot shows a greater separation between the lines for different 'd' values, suggesting that this factor plays a role in normalizing or scaling the data. The convergence of the lines at higher γ values in both plots indicates that the influence of 'd' diminishes as γ increases. The lower starting values on the y-axis for the "Without 1/√d" plot suggest that the factor 1/√d contributes to a higher initial value of |ŵ(t)⋅x|/|ŵ(0)⋅x|.