## [Line Charts with Logarithmic Axes]: Comparison of Normalized Weight Update Magnitude With and Without Scaling by 1/√d
### Overview
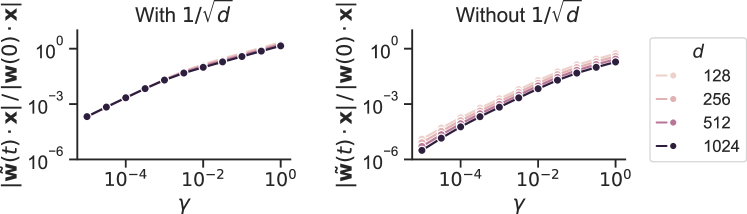
The image displays two side-by-side line charts on a logarithmic scale. The charts compare the evolution of a normalized quantity, likely related to neural network training dynamics, under two different scaling conditions. The left chart is titled "With 1/√d" and the right chart is titled "Without 1/√d". A shared legend on the far right defines four data series corresponding to different values of a parameter `d`.
### Components/Axes
* **Titles:**
* Left Chart: "With 1/√d"
* Right Chart: "Without 1/√d"
* **Y-Axis (Both Charts):**
* Label: `|w̃(t)·x| / |w(0)·x|`
* Scale: Logarithmic, ranging from approximately 10⁻⁶ to 10⁰ (1).
* Major Ticks: 10⁻⁶, 10⁻³, 10⁰.
* **X-Axis (Both Charts):**
* Label: `γ` (Greek letter gamma).
* Scale: Logarithmic, ranging from approximately 10⁻⁵ to 10⁰ (1).
* Major Ticks: 10⁻⁴, 10⁻², 10⁰.
* **Legend (Positioned to the right of both charts):**
* Header: `d`
* Series (from top to bottom in legend, corresponding to line color/shade):
* `128` (Lightest pink/peach color)
* `256` (Medium-light pink)
* `512` (Medium-dark pink/mauve)
* `1024` (Darkest purple/black)
### Detailed Analysis
**Left Chart ("With 1/√d"):**
* **Trend Verification:** All four data series (for d=128, 256, 512, 1024) follow an almost identical, monotonically increasing trend. The lines are tightly clustered, appearing as a single, slightly thickened line.
* **Data Points (Approximate):**
* At γ ≈ 10⁻⁵, the normalized value is ≈ 10⁻⁴.
* At γ ≈ 10⁻⁴, the value is ≈ 10⁻³.
* At γ ≈ 10⁻², the value is ≈ 10⁻¹.
* At γ ≈ 10⁰ (1), the value approaches 10⁰ (1).
* **Spatial Grounding:** The lines originate from the bottom-left and progress to the top-right of the plot area. The legend order (128 to 1024) does not correspond to a visible vertical separation of lines in this chart.
**Right Chart ("Without 1/√d"):**
* **Trend Verification:** All four data series show a monotonically increasing trend. However, there is clear vertical separation between the lines, with the separation increasing as γ increases.
* **Data Points & Series Relationship (Approximate):**
* The series are ordered vertically. For any given γ > 10⁻⁴, the line for `d=128` is the highest, followed by `d=256`, then `d=512`, and the line for `d=1024` is the lowest.
* At γ ≈ 10⁻⁴: Values range from ≈ 10⁻⁵ (for d=1024) to ≈ 10⁻⁴ (for d=128).
* At γ ≈ 10⁰ (1): Values range from ≈ 10⁻¹ (for d=1024) to ≈ 10⁰ (1) (for d=128).
* **Spatial Grounding:** The lines fan out from the bottom-left. The legend's color/shade gradient (light to dark) maps directly to the vertical order of the lines from top to bottom (lightest/highest to darkest/lowest).
### Key Observations
1. **Effect of Scaling:** The primary observation is the dramatic difference between the two charts. The scaling factor `1/√d` in the left chart collapses the behavior of all four `d` values onto a single curve. Without this scaling (right chart), the curves separate significantly based on `d`.
2. **Monotonic Increase:** In both scenarios, the normalized quantity `|w̃(t)·x| / |w(0)·x|` increases with `γ`.
3. **Inverse Relationship with d (Without Scaling):** In the right chart, for a fixed `γ`, a larger dimension `d` results in a smaller normalized value. The relationship appears consistent across the plotted range.
### Interpretation
This figure likely illustrates a concept from the theory of neural network initialization or training dynamics, specifically concerning the scaling of weights or gradients with the network width or dimension `d`.
* **What the data suggests:** The quantity `|w̃(t)·x| / |w(0)·x|` represents the magnitude of a weight update or a feature activation at time `t`, normalized by its initial magnitude. `γ` is likely a parameter controlling the step size or learning rate.
* **How elements relate:** The comparison demonstrates that without proper scaling (right chart), the training dynamics (as measured by this normalized update) are dependent on the network dimension `d`. Larger networks (higher `d`) experience smaller relative updates. Applying the scaling factor `1/√d` (left chart) removes this dependency, making the dynamics invariant to `d`. This is a crucial principle for ensuring consistent behavior across networks of different sizes.
* **Notable Implication:** The "With 1/√d" condition promotes scale invariance, a desirable property for theoretical analysis and for ensuring that hyperparameters (like learning rate) generalize across models of different widths. The "Without" condition shows that failing to scale appropriately leads to dimension-dependent behavior, which could complicate training and hyperparameter tuning.