## Line Graphs: Comparison of |~w(t) · x| / |w(0) · x| with/without 1/√d Scaling
### Overview
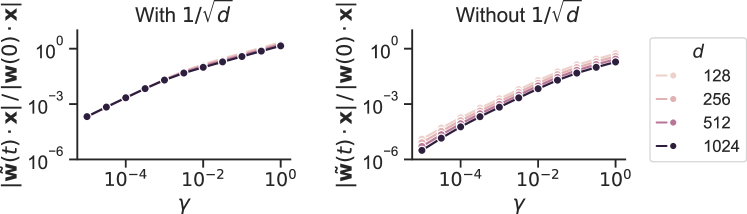
The image contains two side-by-side line graphs comparing the ratio |~w(t) · x| / |w(0) · x| across different values of γ (gamma) and dimensionality (d). The left graph includes a 1/√d scaling factor, while the right graph does not. Both graphs show data for d ∈ {128, 256, 512, 1024}, with distinct color-coded lines for each d value.
### Components/Axes
- **Left Graph (With 1/√d):**
- **X-axis (γ):** Logarithmic scale from 10⁻⁴ to 10⁰.
- **Y-axis:** Ratio |~w(t) · x| / |w(0) · x|, logarithmic scale from 10⁻⁶ to 10⁰.
- **Legend:** Positioned on the right, mapping d values to colors:
- d=128: Light pink
- d=256: Medium pink
- d=512: Dark pink
- d=1024: Black
- **Lines:** Four curves, one per d value, plotted with markers (circles) and error bands (shaded regions).
- **Right Graph (Without 1/√d):**
- Identical axes and legend structure as the left graph.
- Lines exhibit greater separation between d values compared to the left graph.
### Detailed Analysis
#### Left Graph (With 1/√d)
- **Trends:** All lines slope upward as γ increases, but remain tightly clustered. The 1/√d scaling reduces the divergence between d values.
- **d=128 (Light Pink):** Starts near 10⁻⁶ at γ=10⁻⁴, reaches ~10⁻³ at γ=10⁰.
- **d=256 (Medium Pink):** Similar trajectory to d=128 but slightly higher values.
- **d=512 (Dark Pink):** Overlaps with d=256 at lower γ, diverges slightly at higher γ.
- **d=1024 (Black):** Follows the same upward trend but remains closest to the y-axis baseline.
#### Right Graph (Without 1/√d)
- **Trends:** Lines show significantly greater separation, especially at higher γ values. Larger d values produce higher ratios.
- **d=128 (Light Pink):** Starts near 10⁻⁶ at γ=10⁻⁴, reaches ~10⁻² at γ=10⁰.
- **d=256 (Medium Pink):** Starts slightly higher than d=128, reaches ~10⁻¹ at γ=10⁰.
- **d=512 (Dark Pink):** Starts at ~10⁻⁵, reaches ~10⁰ at γ=10⁰.
- **d=1024 (Black):** Starts at ~10⁻⁴, reaches ~10¹ at γ=10⁰.
### Key Observations
1. **Scaling Impact:** The 1/√d factor in the left graph compresses the spread of d values, making their trends more comparable.
2. **Divergence Without Scaling:** In the right graph, larger d values (e.g., 1024) produce orders-of-magnitude higher ratios than smaller d values (e.g., 128) at the same γ.
3. **Consistency:** All lines in both graphs exhibit monotonic increases with γ, but the right graph shows steeper slopes for higher d.
### Interpretation
The graphs demonstrate that the 1/√d scaling factor is critical for normalizing the influence of dimensionality (d) on the ratio |~w(t) · x| / |w(0) · x|. Without this scaling:
- Larger d values dominate the ratio, suggesting that unnormalized models may overemphasize high-dimensional features.
- The left graph’s tighter clustering implies that 1/√d stabilizes the relationship between d and the ratio, potentially improving model generalizability across dimensions.
This analysis aligns with theoretical expectations in high-dimensional spaces, where scaling factors like 1/√d are often used to mitigate the "curse of dimensionality."