## Chart: Training Loss
### Overview
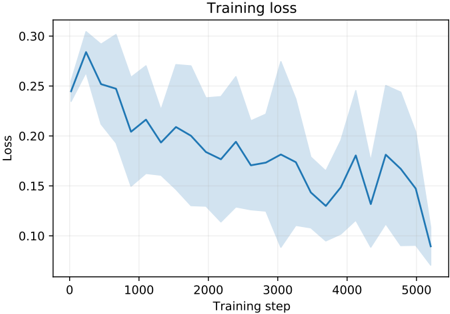
The image is a line chart showing the training loss over training steps. The chart displays a decreasing trend in loss, indicating that the model is learning. A shaded area around the line represents the uncertainty or variance in the loss.
### Components/Axes
* **Title:** Training loss
* **X-axis:** Training step
* Scale: 0 to 5000, with markers at 0, 1000, 2000, 3000, 4000, and 5000.
* **Y-axis:** Loss
* Scale: 0.10 to 0.30, with markers at 0.10, 0.15, 0.20, 0.25, and 0.30.
* **Data Series:**
* A blue line represents the training loss.
* A light blue shaded area surrounds the blue line, indicating the variance or uncertainty in the loss.
### Detailed Analysis
* **Training Loss (Blue Line):**
* The line starts at approximately 0.24 at training step 0.
* It increases to approximately 0.28 by training step 250.
* The line then generally decreases, with some fluctuations, to approximately 0.09 at training step 5000.
* At training step 1000, the loss is approximately 0.25.
* At training step 2000, the loss is approximately 0.20.
* At training step 3000, the loss is approximately 0.18.
* At training step 4000, the loss is approximately 0.13.
* At training step 5000, the loss is approximately 0.09.
* **Uncertainty (Light Blue Shaded Area):**
* The shaded area represents the range of possible loss values around the mean loss (blue line).
* The width of the shaded area varies, indicating different levels of uncertainty at different training steps.
* The uncertainty appears to decrease as the training progresses.
### Key Observations
* The training loss generally decreases over the training steps, indicating that the model is learning.
* There are fluctuations in the loss, suggesting that the learning process is not perfectly smooth.
* The uncertainty in the loss decreases as the training progresses, suggesting that the model is becoming more confident in its predictions.
### Interpretation
The chart demonstrates the training process of a machine learning model. The decreasing training loss indicates that the model is learning to make better predictions. The fluctuations in the loss may be due to the stochastic nature of the training process or to changes in the data distribution. The decreasing uncertainty suggests that the model is becoming more robust and less sensitive to noise in the data. The overall trend suggests that the model is converging to a good solution.