## Line Chart: Training Loss
### Overview
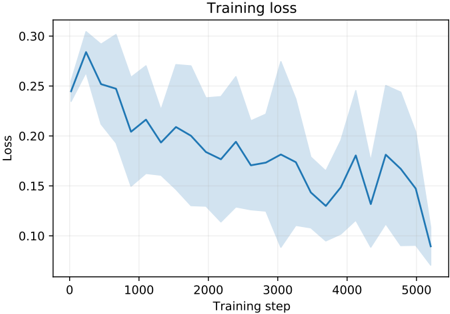
The chart depicts the evolution of training loss over 5,000 training steps. A blue line represents the loss metric, accompanied by a shaded blue region indicating variability or confidence intervals. The loss decreases overall but exhibits fluctuations, with notable peaks and troughs.
### Components/Axes
- **Title**: "Training loss" (centered at the top).
- **X-axis**: Labeled "Training step," scaled from 0 to 5,000 in increments of 1,000.
- **Y-axis**: Labeled "Loss," scaled from 0.10 to 0.30 in increments of 0.05.
- **Legend**: Not explicitly visible, but the blue line and shaded region are visually linked as a single data series.
- **Grid**: Light gray gridlines for reference.
### Detailed Analysis
- **Initial Phase (0–1,000 steps)**:
- Loss starts at ~0.25, peaks at ~0.28 near step 500, then declines to ~0.20 by step 1,000.
- Shaded region width is moderate, suggesting moderate uncertainty.
- **Mid-Phase (1,000–3,000 steps)**:
- Loss fluctuates between ~0.18 and ~0.22, with a trough at ~0.17 near step 2,000.
- Shaded region narrows slightly, indicating reduced uncertainty.
- **Late Phase (3,000–5,000 steps)**:
- Loss drops to ~0.13 near step 3,000, rises to ~0.18 near step 4,000, then falls sharply to ~0.09 by step 5,000.
- Shaded region becomes narrower, reflecting increased confidence in loss estimates.
### Key Observations
1. **Overall Trend**: Loss decreases monotonically from ~0.25 to ~0.09, with periodic fluctuations.
2. **Peaks**: Notable spikes at steps ~500 (~0.28) and ~4,000 (~0.18), possibly indicating training instability or data shifts.
3. **Uncertainty**: The shaded region’s width correlates with loss variability, widening during mid-phase fluctuations and narrowing toward convergence.
4. **Final Convergence**: Loss stabilizes near 0.09 by step 5,000, suggesting model convergence.
### Interpretation
The chart demonstrates typical training dynamics: initial instability, gradual stabilization, and eventual convergence. The shaded region’s narrowing implies improving model certainty over time. Peaks at steps 500 and 4,000 may reflect transient challenges (e.g., learning rate adjustments or data distribution shifts). The final loss value (~0.09) indicates effective training, though the exact metric (e.g., MSE, cross-entropy) is unspecified. The absence of a legend limits interpretation of the shaded region’s exact meaning (e.g., standard deviation vs. percentile bounds).