## Scatter Plot: LongBench Accuracy vs KV Cache Size (Repobench Dataset)
### Overview
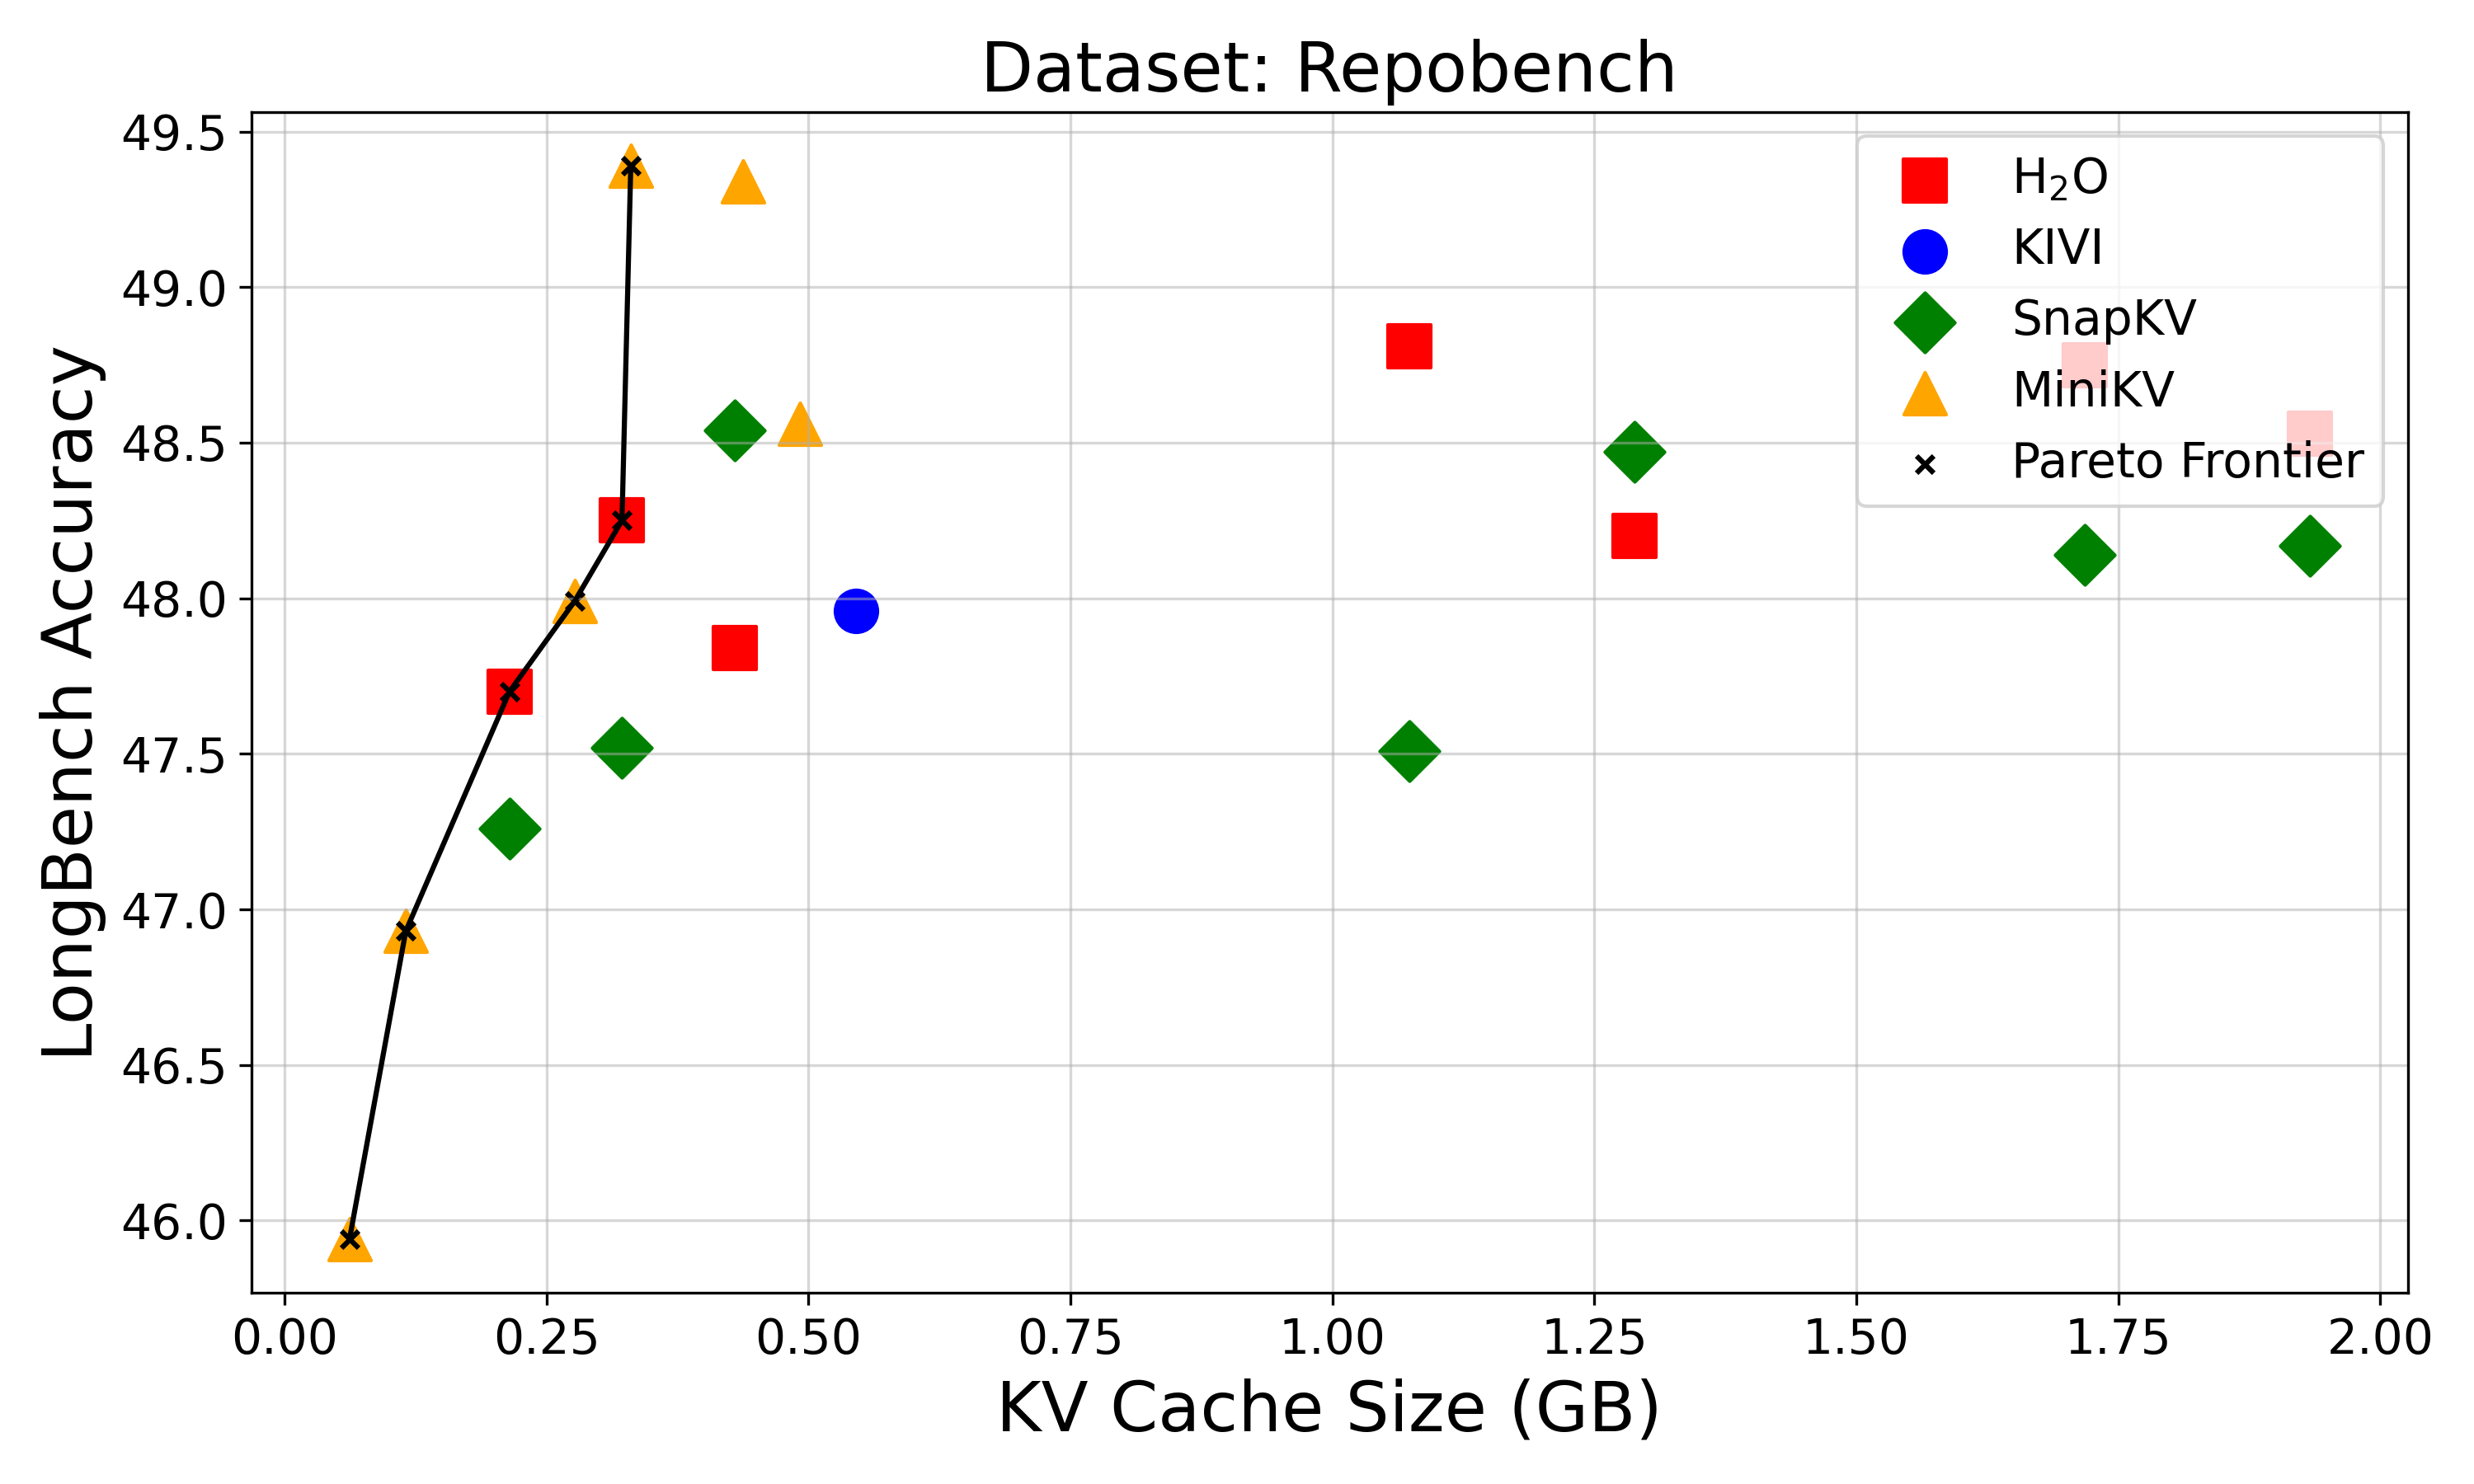
The chart visualizes the relationship between KV cache size (in GB) and LongBench accuracy for five different systems (H2O, KIVI, SnapKV, MiniKV) against the Pareto Frontier. Data points are plotted with distinct markers/colors, and the Pareto Frontier is represented by a black line with cross markers.
### Components/Axes
- **X-axis**: KV Cache Size (GB) ranging from 0.00 to 2.00 in 0.25 increments.
- **Y-axis**: LongBench Accuracy ranging from 46.0 to 49.5 in 0.5 increments.
- **Legend**: Located at the top-right corner, mapping:
- Red squares: H2O
- Blue circle: KIVI
- Green diamonds: SnapKV
- Yellow triangles: MiniKV
- Black crosses: Pareto Frontier
### Detailed Analysis
#### Data Series Trends
1. **H2O (Red Squares)**:
- Points at (0.25, ~47.7), (0.5, ~47.9), (1.0, ~48.8), (1.25, ~48.3).
- Trend: Initial increase in accuracy with cache size, followed by a plateau/decline.
2. **KIVI (Blue Circle)**:
- Single point at (0.5, ~47.9).
- No trend observable due to single data point.
3. **SnapKV (Green Diamonds)**:
- Points at (0.25, ~47.3), (0.5, ~48.5), (1.0, ~47.5), (1.25, ~48.4), (1.75, ~48.1), (2.0, ~48.2).
- Trend: Fluctuating accuracy with no clear monotonic relationship.
4. **MiniKV (Yellow Triangles)**:
- Points at (0.1, ~46.9), (0.25, ~48.0), (0.5, ~48.5), (0.75, ~48.6).
- Trend: Steady increase in accuracy up to 0.75 GB, then no further data.
5. **Pareto Frontier (Black Crosses)**:
- Connects points at (0.1, ~46.9) → (0.5, ~48.5) → (0.75, ~48.6) → (1.0, ~48.8).
- Represents the optimal trade-off curve where increasing cache size does not yield proportional accuracy gains.
### Key Observations
- **Pareto Frontier Dominance**: Most data points lie below the frontier, indicating suboptimal performance relative to the trade-off curve.
- **H2O Outlier**: The (1.0, ~48.8) point exceeds the Pareto Frontier, suggesting exceptional performance at 1.0 GB.
- **MiniKV Efficiency**: Achieves high accuracy (48.6) at 0.75 GB, outperforming others at smaller cache sizes.
- **SnapKV Volatility**: Accuracy drops from 48.5 (0.5 GB) to 47.5 (1.0 GB), then recovers slightly.
### Interpretation
The chart demonstrates that **cache size does not universally correlate with accuracy improvements**. The Pareto Frontier highlights diminishing returns beyond 0.75–1.0 GB for most systems. Notably:
- **H2O** and **MiniKV** show strong performance at lower cache sizes, suggesting algorithmic efficiency.
- **SnapKV**'s fluctuating results imply potential instability or suboptimal cache utilization.
- **KIVI**'s single data point limits conclusions but aligns with mid-range performance.
The data underscores the importance of algorithmic design over raw hardware scaling, as the Pareto Frontier indicates that further cache expansion beyond ~1.0 GB yields minimal accuracy gains for most systems.