## Line Graph: Accuracy vs. Scale for Different Sample Sizes
### Overview
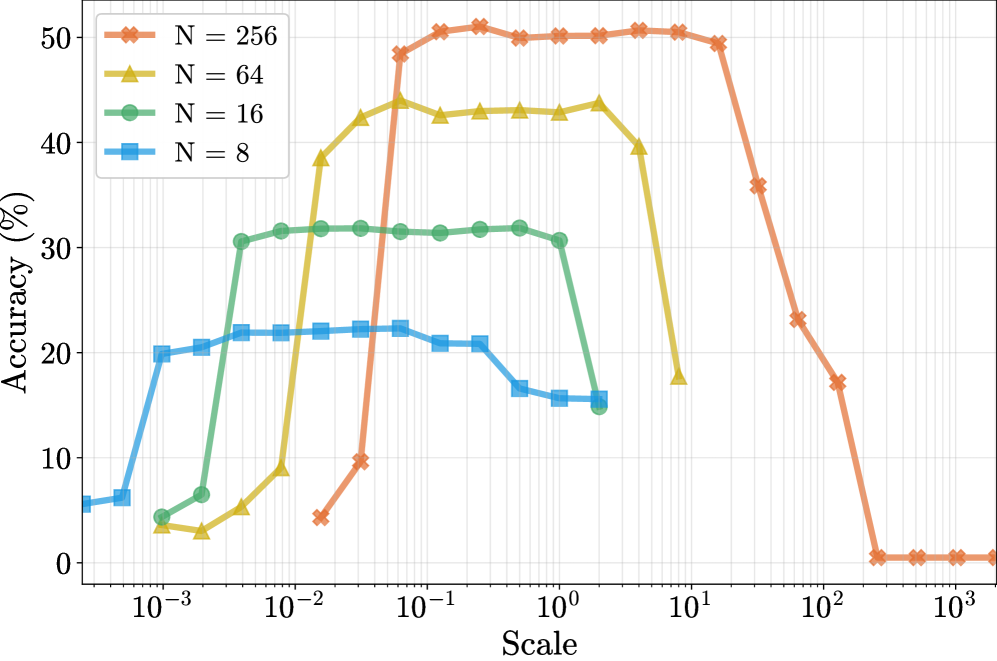
The graph illustrates the relationship between "Scale" (x-axis) and "Accuracy (%)" (y-axis) for four distinct sample sizes (N = 8, 16, 64, 256). Each line represents a unique sample size, with accuracy peaking at specific scales before declining sharply. The largest sample size (N = 256) achieves the highest peak accuracy, while smaller samples exhibit lower peaks and more gradual declines.
### Components/Axes
- **X-axis (Scale)**: Logarithmic scale ranging from 10⁻³ to 10³.
- **Y-axis (Accuracy %)**: Linear scale from 0% to 50%.
- **Legend**: Located in the top-left corner, mapping colors/symbols to sample sizes:
- Red crosses (×): N = 256
- Yellow triangles (▲): N = 64
- Green circles (●): N = 16
- Blue squares (■): N = 8
### Detailed Analysis
1. **N = 256 (Red ×)**:
- Starts at 0% accuracy for scales < 10⁻².
- Rises sharply to ~50% at scale 10⁻¹.
- Peaks at 50% between 10⁻¹ and 10⁰, then declines steeply to 0% by 10¹.
- Remains at 0% for scales ≥ 10².
2. **N = 64 (Yellow ▲)**:
- Begins at ~5% accuracy at 10⁻³.
- Increases to ~45% at 10⁻², peaking between 10⁻² and 10⁻¹.
- Drops to ~20% at 10⁰, then declines to 0% by 10¹.
3. **N = 16 (Green ●)**:
- Starts at ~5% at 10⁻³.
- Rises to ~30% at 10⁻², peaking between 10⁻² and 10⁻¹.
- Declines to ~15% at 10⁰, then drops to 0% by 10¹.
4. **N = 8 (Blue ■)**:
- Begins at ~5% at 10⁻³.
- Peaks at ~20% at 10⁻², then declines to ~10% at 10⁰.
- Drops to 0% by 10¹.
### Key Observations
- **Peak Accuracy**: Larger sample sizes (N = 256) achieve higher peak accuracy (~50%) compared to smaller sizes (N = 8 peaks at ~20%).
- **Scale of Peak**: Larger N values peak at higher scales (e.g., N = 256 peaks at 10⁻¹, N = 8 at 10⁻²).
- **Decline Pattern**: All lines exhibit a sharp drop after their peak, with larger N values experiencing steeper declines.
- **Overlap**: Lines for N = 16 and N = 8 overlap slightly at scales < 10⁻².
### Interpretation
The data suggests a trade-off between sample size and model performance:
- **Larger Samples (N = 256)**: Achieve higher accuracy but overfit more severely, as evidenced by the abrupt decline post-peak.
- **Smaller Samples (N = 8)**: Generalize better (slower decline) but with lower peak accuracy.
- **Scale Sensitivity**: Accuracy is highly sensitive to scale, with optimal performance occurring at specific scales inversely related to sample size.
- **Practical Implication**: Increasing sample size improves peak performance but may reduce robustness at larger scales, highlighting the need for regularization or adaptive scaling strategies.