## Chart: Quantum Measurement Expectation Values vs. Parameter g
### Overview
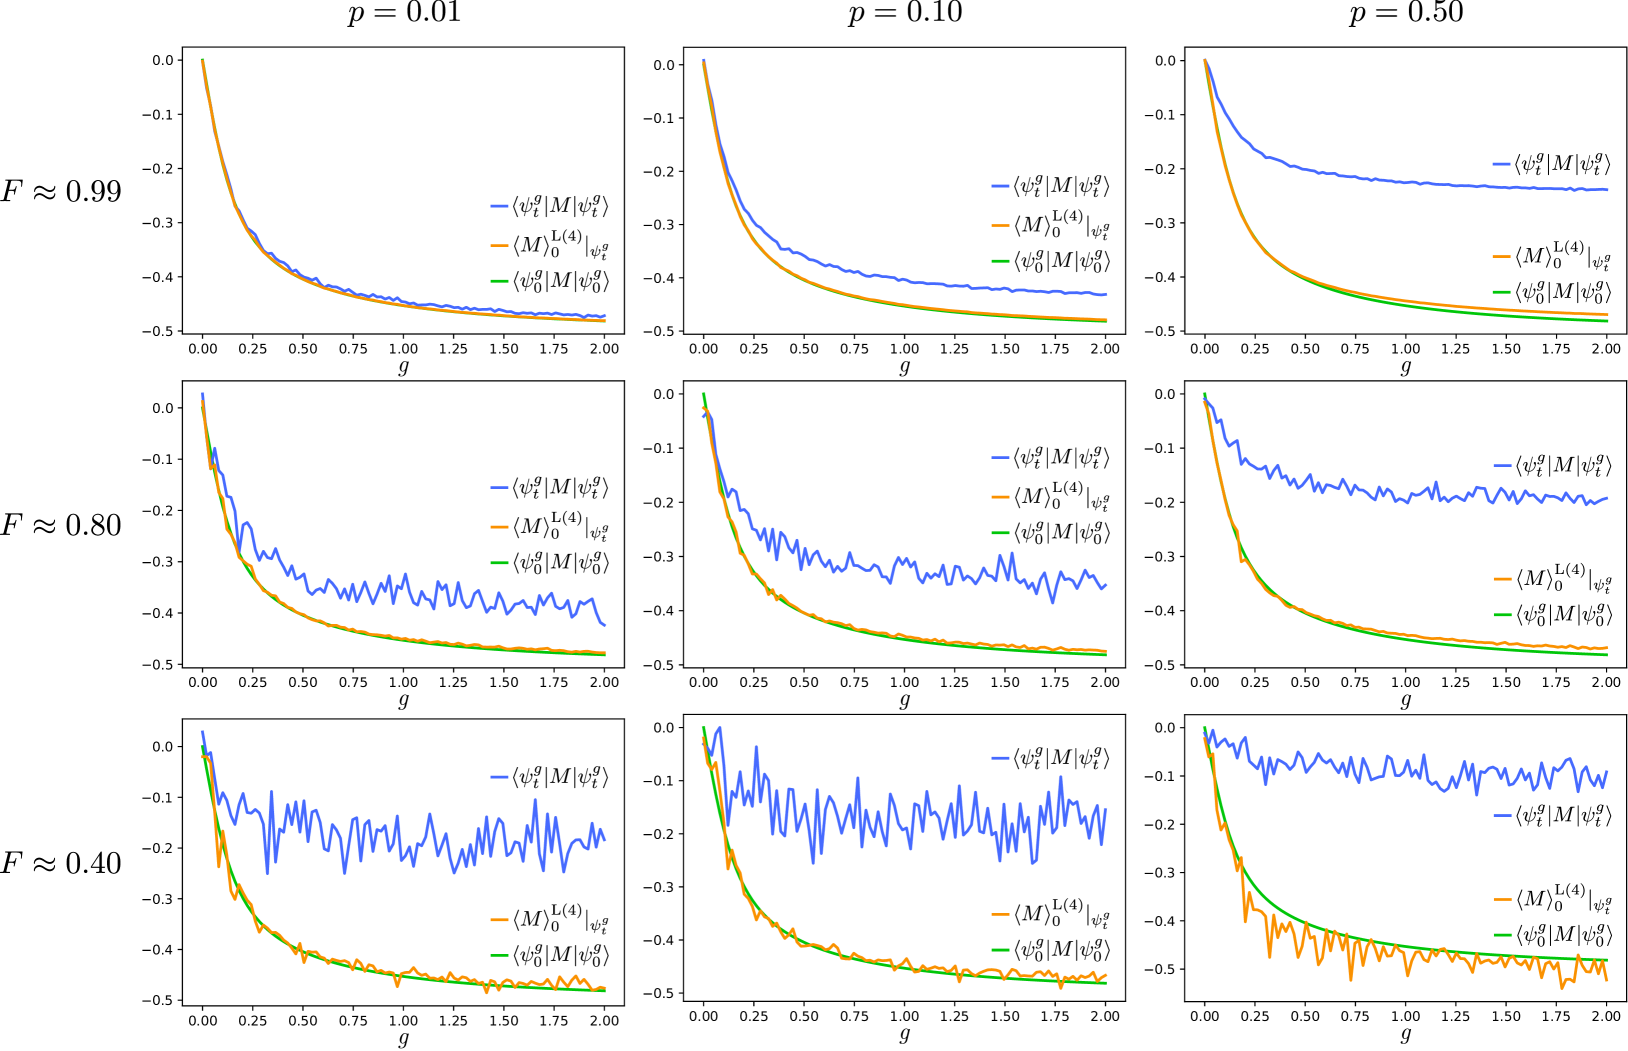
The image presents a series of line plots arranged in a 3x3 grid. Each plot displays the expectation values of quantum mechanical operators as a function of a parameter 'g'. The plots are organized by two parameters: 'p' (columns) and 'F' (rows). The x-axis represents 'g', and the y-axis represents the expectation value. Three different expectation values are plotted in each subplot, distinguished by color.
### Components/Axes
* **X-axis:** 'g', ranging from 0.00 to 2.00, with tick marks at intervals of 0.25.
* **Y-axis:** Expectation value, ranging from -0.5 to 0.0, with tick marks at intervals of 0.1.
* **Titles:**
* Top row: p = 0.01, p = 0.10, p = 0.50
* Left column: F ≈ 0.99, F ≈ 0.80, F ≈ 0.40
* **Legend (present in each subplot):**
* Blue: ⟨ψg t|M|ψg t⟩
* Orange: ⟨M⟩(4)0|ψg t⟩
* Green: ⟨ψg 0|M|ψg 0⟩
### Detailed Analysis
The data is presented in a 3x3 grid, where each cell contains a plot of three different expectation values as a function of 'g'. The columns represent different values of 'p' (0.01, 0.10, 0.50), and the rows represent different values of 'F' (approximately 0.99, 0.80, and 0.40).
**Row 1: F ≈ 0.99**
* **p = 0.01:**
* Blue (⟨ψg t|M|ψg t⟩): Starts at approximately 0.0 and decreases to around -0.45.
* Orange (⟨M⟩(4)0|ψg t⟩): Starts at approximately 0.0 and decreases to around -0.5.
* Green (⟨ψg 0|M|ψg 0⟩): Starts at approximately 0.0 and decreases to around -0.5.
* **p = 0.10:**
* Blue (⟨ψg t|M|ψg t⟩): Starts at approximately 0.0 and decreases to around -0.4.
* Orange (⟨M⟩(4)0|ψg t⟩): Starts at approximately 0.0 and decreases to around -0.5.
* Green (⟨ψg 0|M|ψg 0⟩): Starts at approximately 0.0 and decreases to around -0.5.
* **p = 0.50:**
* Blue (⟨ψg t|M|ψg t⟩): Starts at approximately -0.1 and decreases to around -0.2.
* Orange (⟨M⟩(4)0|ψg t⟩): Starts at approximately 0.0 and decreases to around -0.5.
* Green (⟨ψg 0|M|ψg 0⟩): Starts at approximately 0.0 and decreases to around -0.5.
**Row 2: F ≈ 0.80**
* **p = 0.01:**
* Blue (⟨ψg t|M|ψg t⟩): Starts at approximately 0.0 and fluctuates, ending around -0.4.
* Orange (⟨M⟩(4)0|ψg t⟩): Starts at approximately 0.0 and decreases to around -0.5.
* Green (⟨ψg 0|M|ψg 0⟩): Starts at approximately 0.0 and decreases to around -0.5.
* **p = 0.10:**
* Blue (⟨ψg t|M|ψg t⟩): Starts at approximately 0.0 and fluctuates, ending around -0.1.
* Orange (⟨M⟩(4)0|ψg t⟩): Starts at approximately 0.0 and decreases to around -0.5.
* Green (⟨ψg 0|M|ψg 0⟩): Starts at approximately 0.0 and decreases to around -0.5.
* **p = 0.50:**
* Blue (⟨ψg t|M|ψg t⟩): Starts at approximately -0.1 and fluctuates, ending around -0.2.
* Orange (⟨M⟩(4)0|ψg t⟩): Starts at approximately 0.0 and decreases to around -0.5.
* Green (⟨ψg 0|M|ψg 0⟩): Starts at approximately 0.0 and decreases to around -0.5.
**Row 3: F ≈ 0.40**
* **p = 0.01:**
* Blue (⟨ψg t|M|ψg t⟩): Starts at approximately 0.0 and fluctuates significantly, ending around -0.1.
* Orange (⟨M⟩(4)0|ψg t⟩): Starts at approximately 0.0 and decreases to around -0.5.
* Green (⟨ψg 0|M|ψg 0⟩): Starts at approximately 0.0 and decreases to around -0.5.
* **p = 0.10:**
* Blue (⟨ψg t|M|ψg t⟩): Starts at approximately 0.0 and fluctuates significantly, ending around -0.1.
* Orange (⟨M⟩(4)0|ψg t⟩): Starts at approximately 0.0 and decreases to around -0.5.
* Green (⟨ψg 0|M|ψg 0⟩): Starts at approximately 0.0 and decreases to around -0.5.
* **p = 0.50:**
* Blue (⟨ψg t|M|ψg t⟩): Starts at approximately -0.1 and fluctuates significantly, ending around -0.2.
* Orange (⟨M⟩(4)0|ψg t⟩): Starts at approximately 0.0 and decreases to around -0.5, with significant fluctuations.
* Green (⟨ψg 0|M|ψg 0⟩): Starts at approximately 0.0 and decreases to around -0.5.
### Key Observations
* The blue line (⟨ψg t|M|ψg t⟩) shows the most variation with changes in 'p' and 'F'. It generally fluctuates more as 'F' decreases.
* The orange (⟨M⟩(4)0|ψg t⟩) and green (⟨ψg 0|M|ψg 0⟩) lines tend to converge and remain relatively stable, decreasing from 0.0 to approximately -0.5 as 'g' increases.
* Higher values of 'p' seem to result in less change in the blue line as 'g' increases, especially when 'F' is low.
### Interpretation
The plots illustrate how the expectation values of certain quantum mechanical operators change with the parameter 'g' under different conditions defined by 'p' and 'F'. The parameter 'F' seems to influence the stability of the system, with lower values leading to more fluctuations in the expectation value represented by the blue line. The parameter 'p' appears to affect the overall magnitude of the expectation value, particularly for the blue line. The convergence of the orange and green lines suggests that the corresponding expectation values are less sensitive to changes in 'p' and 'F' compared to the blue line. The data suggests that the system's behavior is complex and depends on the interplay between the parameters 'g', 'p', and 'F'.