## Line Graph Grid: Metric Evolution Across Parameters
### Overview
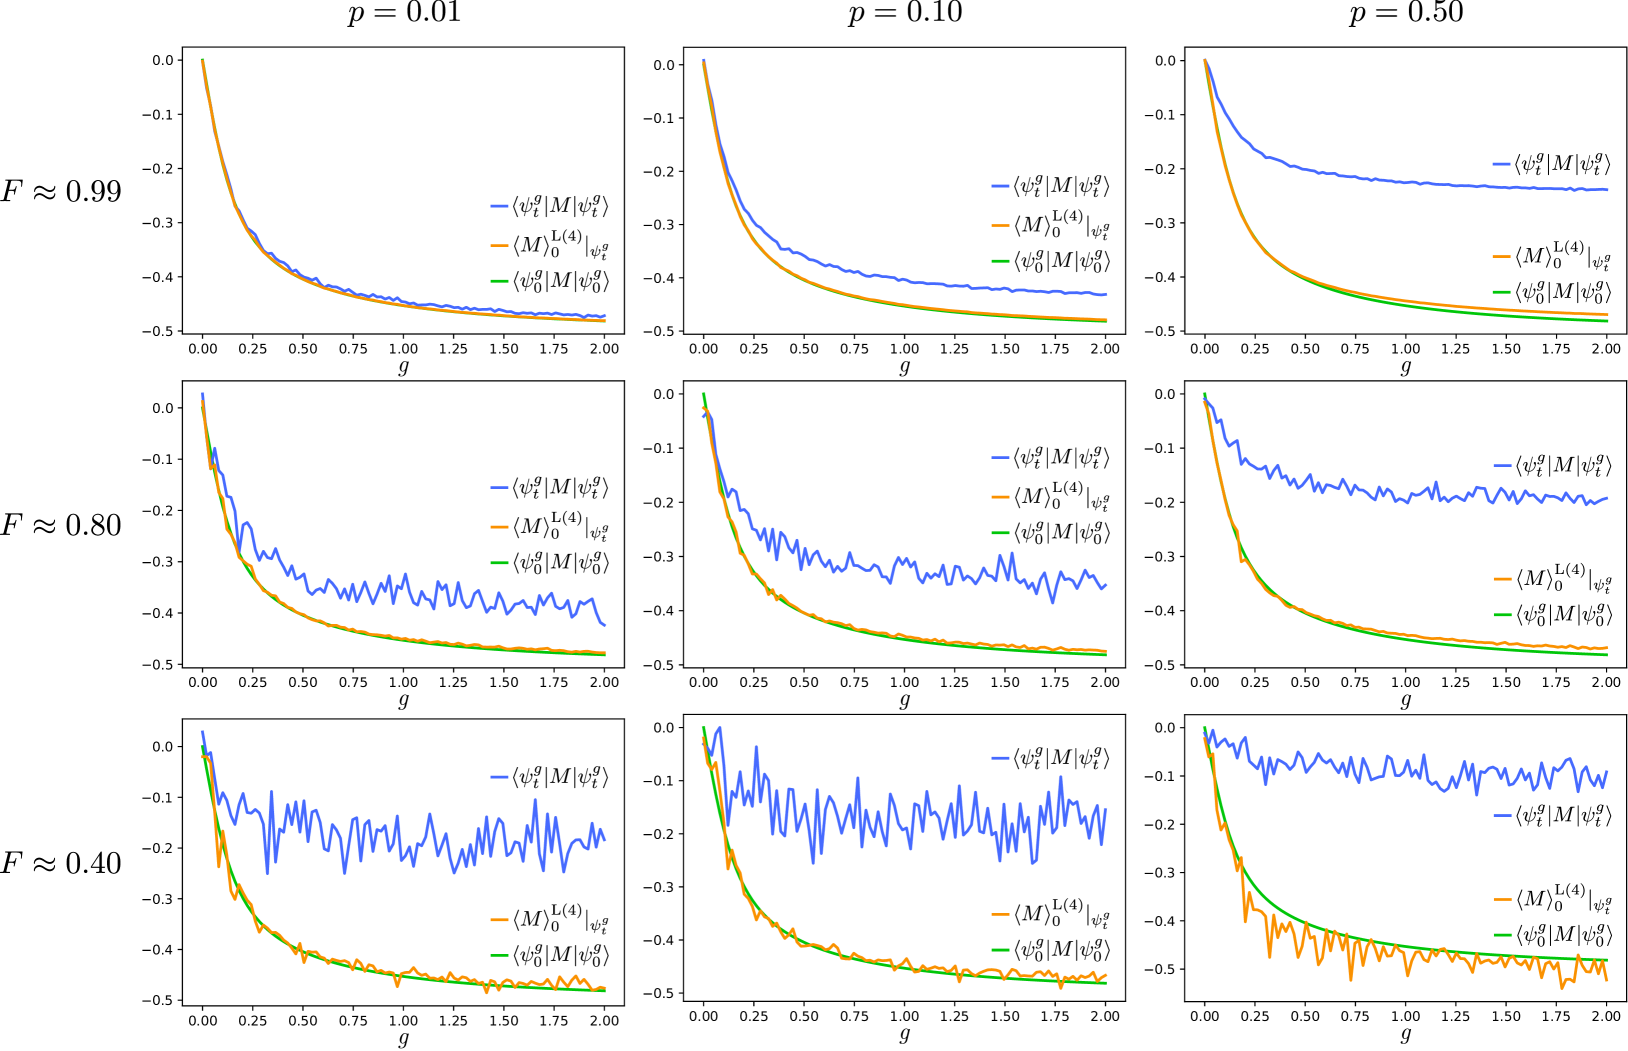
A 3x3 grid of line graphs visualizes the evolution of three metrics (⟨ψ_t^g|M|ψ_t^g⟩, ⟨M⟩₀^(L(4))|ψ_t^g⟩, ⟨ψ₀^g|M|ψ₀^g⟩) across parameter space. Each subplot corresponds to a unique combination of:
- **p** (horizontal axis labels: 0.01, 0.10, 0.50)
- **F** (row labels: ≈0.99, ≈0.80, ≈0.40)
- **g** (x-axis: 0.00–2.00)
### Components/Axes
- **X-axis**: Parameter `g` (0.00–2.00 in 0.25 increments)
- **Y-axis**: Metric value `F` (-0.5 to 0.0)
- **Legends** (right-aligned in each subplot):
- **Blue**: ⟨ψ_t^g|M|ψ_t^g⟩
- **Orange**: ⟨M⟩₀^(L(4))|ψ_t^g⟩
- **Green**: ⟨ψ₀^g|M|ψ₀^g⟩
### Detailed Analysis
#### Top Row (F ≈ 0.99)
- **p = 0.01**: All lines decline steeply, with blue > orange > green. Minimal noise.
- **p = 0.10**: Similar trend but with slight oscillations in orange/green lines.
- **p = 0.50**: Blue line stabilizes near -0.1; orange/green lines flatten with minor fluctuations.
#### Middle Row (F ≈ 0.80)
- **p = 0.01**: Blue line dominates; orange/green lines converge near -0.3.
- **p = 0.10**: Increased noise in all lines; blue remains highest.
- **p = 0.50**: Chaotic oscillations; blue line peaks at -0.2, green dips to -0.4.
#### Bottom Row (F ≈ 0.40)
- **p = 0.01**: Blue line oscillates between -0.1 and -0.3; orange/green lines show erratic behavior.
- **p = 0.10**: All lines exhibit high-frequency noise; blue line averages -0.25.
- **p = 0.50**: Blue line stabilizes near -0.3; orange line dips to -0.4; green line stabilizes at -0.5.
### Key Observations
1. **Metric Hierarchy**: ⟨ψ_t^g|M|ψ_t^g⟩ (blue) consistently exceeds ⟨M⟩₀^(L(4))|ψ_t^g⟩ (orange), which in turn exceeds ⟨ψ₀^g|M|ψ₀^g⟩ (green).
2. **p-Dependent Noise**: Higher `p` values correlate with increased metric volatility, especially at lower `F` (≈0.40).
3. **F-Threshold Behavior**: At F ≈ 0.99, metrics show smooth decay; at F ≈ 0.40, metrics become highly unstable.
4. **g-Convergence**: All metrics approach asymptotic values near `g = 2.00`, with ⟨ψ₀^g|M|ψ₀^g⟩ (green) converging fastest.
### Interpretation
The data suggests a **phase transition** in system behavior as `F` decreases:
- **High F (≈0.99)**: Metrics exhibit deterministic decay, indicating stable system dynamics.
- **Low F (≈0.40)**: Metrics become stochastic, implying chaotic or critical system states.
- **p as Noise Injector**: Higher `p` values amplify metric variability, potentially modeling external perturbations or measurement errors.
- **Metric Roles**:
- ⟨ψ_t^g|M|ψ_t^g⟩ (blue): Likely represents target state fidelity.
- ⟨ψ₀^g|M|ψ₀^g⟩ (green): Baseline reference state.
- ⟨M⟩₀^(L(4))|ψ_t^g⟩ (orange): Intermediate metric showing transitional behavior.
The grid highlights trade-offs between parameter stability (`p`), system fidelity (`F`), and metric robustness. At critical `F` thresholds, small `p` increases trigger disproportionate metric degradation, suggesting sensitivity to external factors in low-fidelity regimes.