## Diagram: Cartesian Product Visualization
### Overview
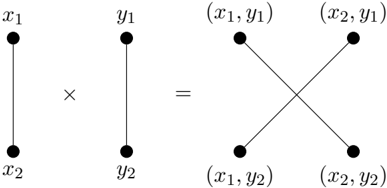
The image depicts a mathematical diagram illustrating the Cartesian product of two sets, represented by vertical lines labeled `x1`, `x2` (left) and `y1`, `y2` (right). The cross product symbol (`×`) connects these sets, resulting in a grid of four points: `(x1,y1)`, `(x2,y1)`, `(x1,y2)`, and `(x2,y2)`.
### Components/Axes
- **Left Vertical Line**:
- Labels: `x1` (top), `x2` (bottom).
- Elements: Two black dots connected by a vertical line.
- **Right Vertical Line**:
- Labels: `y1` (top), `y2` (bottom).
- Elements: Two black dots connected by a vertical line.
- **Cross Product Symbol**:
- Positioned between the two vertical lines.
- **Resulting Grid**:
- Four points labeled as ordered pairs:
- Top-left: `(x1,y1)`
- Top-right: `(x2,y1)`
- Bottom-left: `(x1,y2)`
- Bottom-right: `(x2,y2)`
- Lines connect corresponding `x` and `y` values diagonally.
### Detailed Analysis
- **Labels**: All textual elements are in Latin script (English). No non-Latin text is present.
- **Flow**:
1. Input sets (`x1,x2` and `y1,y2`) are combined via the cross product.
2. Output is a grid of all possible ordered pairs.
- **Visual Structure**:
- The diagram uses geometric lines and dots to represent abstract mathematical relationships.
- No numerical values, scales, or legends are present.
### Key Observations
- The diagram explicitly shows the **one-to-one correspondence** between elements of the input sets and the resulting pairs.
- The absence of numerical data suggests this is a conceptual illustration rather than a data-driven chart.
- The diagonal lines in the grid emphasize the pairing of `x` and `y` values.
### Interpretation
This diagram visually represents the **Cartesian product** of two sets, a foundational concept in set theory and mathematics. By combining elements from two distinct sets (`x` and `y`), it demonstrates how ordered pairs are formed. The structure implies that every element from the first set (`x1,x2`) is paired with every element from the second set (`y1,y2`), resulting in four unique combinations. The simplicity of the diagram underscores its purpose: to clarify the abstract relationship between sets without relying on numerical data.
No outliers, trends, or anomalies are present, as the diagram is purely schematic. The focus is on logical relationships rather than quantitative analysis.