## Line Graph: Newly Connected Pairs (sampled) vs. Iteration
### Overview
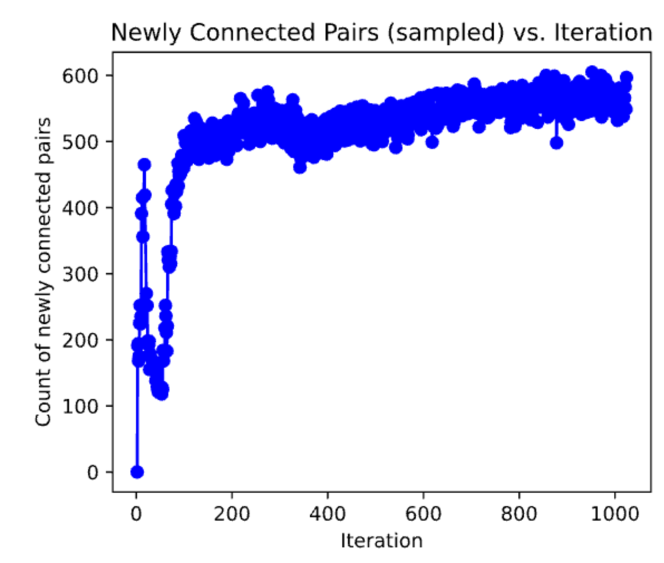
This image is a 2D line graph with scatter-style markers displaying the relationship between algorithmic iterations and the count of newly connected pairs. The data is represented by a single, continuous blue line connecting solid blue circular markers. The graph shows extreme initial volatility followed by a long-term, noisy, but generally upward trend.
*Language Declaration:* All text in this image is in English. No other languages are present.
### Components/Axes
**Header Region:**
* **Title (Top Center):** "Newly Connected Pairs (sampled) vs. Iteration"
**Left Region (Y-Axis):**
* **Label (Rotated 90 degrees, centered vertically):** "Count of newly connected pairs"
* **Scale:** Linear scale.
* **Tick Markers:** 0, 100, 200, 300, 400, 500, 600.
**Bottom Region (X-Axis):**
* **Label (Bottom Center):** "Iteration"
* **Scale:** Linear scale.
* **Tick Markers:** 0, 200, 400, 600, 800, 1000.
**Main Chart Region:**
* **Data Series:** A single series represented by solid blue circular markers connected by a solid blue line. There is no explicit legend box, as the title and axes define the single variable being plotted.
### Detailed Analysis
*Trend Verification & Spatial Grounding:*
The data series begins at the bottom-left corner at the origin. It immediately exhibits a violent upward spike, followed by a sharp downward crash. After this initial turbulence, the line slopes steeply upward again, rounding off into a thick, highly clustered band of data points that slowly trends upward toward the top-right of the chart area.
**Extracted Data Points & Trends (Approximate values with uncertainty):**
1. **Initialization (Iteration 0):** The graph starts exactly at `X: 0, Y: 0`.
2. **Initial Spike (Iterations ~1 to ~20):** The line shoots almost vertically upward.
* *Peak:* Reaches a local maximum at approximately `X: ~15, Y: ~465`.
3. **Initial Crash (Iterations ~20 to ~50):** The trend reverses sharply, dropping rapidly.
* *Trough:* Hits a local minimum at approximately `X: ~50, Y: ~120`.
4. **Rapid Recovery (Iterations ~50 to ~150):** The line slopes steeply upward again, recovering the lost ground.
* *Recovery Point:* Reaches approximately `X: ~150, Y: ~500`.
5. **First Plateau & Dip (Iterations ~150 to ~350):** The trend flattens out with high variance (a thick band of blue circles). It peaks slightly before experiencing a noticeable dip.
* *Local Peak:* Approximately `X: ~250, Y: ~570`.
* *Dip:* Drops to approximately `X: ~340, Y: ~460`.
6. **Long-Term Steady Growth (Iterations ~350 to >1000):** The line slopes upward at a very gradual angle. The data is highly noisy, creating a thick band of markers spanning roughly 50 to 80 units on the Y-axis at any given X value.
* *Midpoint:* At `X: 600`, values fluctuate between `Y: ~500` and `Y: ~560`.
* *Notable Outlier:* A distinct downward spike occurs at approximately `X: ~880, Y: ~500`.
* *Endpoint:* By `X: 1000` and slightly beyond, the data band fluctuates between `Y: ~530` and `Y: ~600`.
### Key Observations
* **Extreme Early Volatility:** The most striking feature is the massive fluctuation within the first 100 iterations (0 -> 465 -> 120 -> 500).
* **High Variance/Noise:** After iteration 150, the data does not form a clean, thin line. Instead, the dense clustering of blue circular markers indicates significant iteration-to-iteration variance (noise) within a consistent broader trend.
* **Asymptotic Tendency:** While the trend from iteration 400 to 1000 is upward, the rate of growth is decelerating, suggesting it may be approaching an upper bound or steady-state capacity slightly above 600.
### Interpretation
This graph likely represents the performance or behavior of a network algorithm, graph generation model, or machine learning clustering process over time (iterations).
* **The "Burn-in" Phase:** The extreme volatility between iterations 0 and 100 strongly suggests an initialization or "burn-in" phase. The algorithm rapidly makes connections (the spike to 465), realizes many are invalid or suboptimal based on its parameters, prunes them (the crash to 120), and then finds a more stable heuristic to begin building valid connections (the climb to 500).
* **Exploration vs. Exploitation:** The steady, thick band of data from iteration 350 onward represents the algorithm in its primary operational phase. The fact that it is still finding "newly connected pairs" at a high rate (500-600 per iteration) suggests either a continuously expanding dataset or an algorithm that is constantly exploring new permutations.
* **The Noise:** The thickness of the line (the variance) indicates that the number of connections found per iteration is not uniform; it depends heavily on the specific localized data being processed in that specific iteration step.
* **Overall Meaning:** The system successfully stabilizes after a chaotic start and settles into a highly productive, albeit noisy, steady state of discovering new network pairs, with a slight overall increase in efficiency or opportunity as the iterations progress.