## Line Chart: Newly Connected Pairs (sampled) vs. Iteration
### Overview
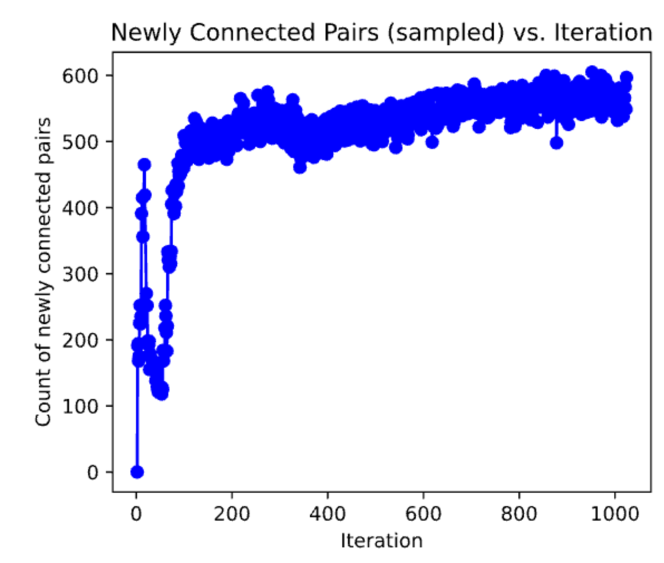
The image is a line chart showing the relationship between the number of newly connected pairs (sampled) and the iteration number. The chart displays a single data series, represented by a blue line, which initially increases rapidly and then plateaus with some fluctuations.
### Components/Axes
* **Title:** Newly Connected Pairs (sampled) vs. Iteration
* **X-axis:** Iteration
* Scale: 0 to 1000, with tick marks at 0, 200, 400, 600, 800, and 1000.
* **Y-axis:** Count of newly connected pairs
* Scale: 0 to 600, with tick marks at 0, 100, 200, 300, 400, 500, and 600.
* **Data Series:**
* Newly Connected Pairs (sampled) - represented by a blue line.
### Detailed Analysis
The blue line represents the count of newly connected pairs at each iteration.
* **Initial Phase (Iteration 0-200):** The line starts at approximately 0 at iteration 0. It rapidly increases to approximately 470 around iteration 50, then fluctuates between 450 and 550 until iteration 200.
* **Plateau Phase (Iteration 200-1000):** From iteration 200 onwards, the line generally plateaus, fluctuating between approximately 470 and 600. There are some dips and peaks, but the overall trend is relatively stable. The line ends at approximately 580 at iteration 1000.
Here are some approximate data points:
* Iteration 0: ~0
* Iteration 25: ~250
* Iteration 50: ~470
* Iteration 100: ~320
* Iteration 200: ~520
* Iteration 400: ~550
* Iteration 600: ~530
* Iteration 800: ~550
* Iteration 1000: ~580
### Key Observations
* The number of newly connected pairs increases rapidly in the initial iterations.
* The number of newly connected pairs plateaus after approximately 200 iterations.
* There are fluctuations in the number of newly connected pairs even after the plateau phase.
### Interpretation
The chart suggests that the process of forming new connections is most active in the early iterations. After a certain point (around 200 iterations), the rate of forming new connections slows down significantly, and the system reaches a state of relative equilibrium. The fluctuations observed after the plateau phase could be due to random variations or other factors influencing the connection process. The data demonstrates a diminishing return in new connections as the number of iterations increases.