## Diagram: Organizational Challenges and Constraints
### Overview
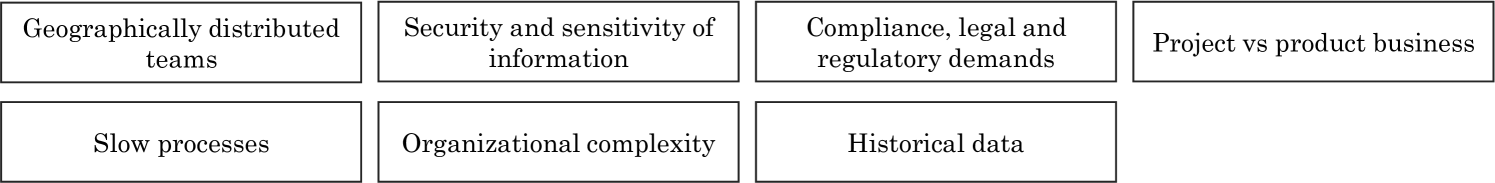
The image depicts a structured diagram with eight labeled boxes arranged in two rows. The boxes represent distinct factors or challenges, with one empty box in the bottom-right corner. The labels suggest themes related to project management, compliance, security, and organizational dynamics.
### Components/Axes
- **Structure**: Two rows of labeled boxes (4 in the top row, 3 in the bottom row, 1 empty).
- **Labels**:
- **Top Row**:
1. Geographically distributed teams
2. Security and sensitivity of information
3. Compliance, legal and regulatory demands
4. Project vs product business
- **Bottom Row**:
1. Slow processes
2. Organizational complexity
3. Historical data
- **Empty Box**: Bottom-right position (no label).
### Detailed Analysis
- **Labels**: All textual content is explicitly stated in the boxes. No numerical values, scales, or legends are present.
- **Spatial Grounding**:
- Top row spans the full width of the diagram.
- Bottom row aligns with the top row but has one fewer box (3 vs. 4).
- The empty box is positioned at the bottom-right, creating visual asymmetry.
### Key Observations
1. **Asymmetry**: The bottom row has one fewer labeled box than the top row, with the final box left empty.
2. **Thematic Grouping**:
- Top row emphasizes external/internal constraints (geography, security, compliance, business model).
- Bottom row focuses on internal operational challenges (processes, complexity, historical data).
3. **Missing Element**: The empty box may imply an unaddressed factor or a placeholder for future consideration.
### Interpretation
This diagram likely represents a framework for identifying challenges in managing projects or products within complex organizations. The labels suggest:
- **Geographical distribution** and **security concerns** highlight risks in decentralized teams and sensitive data handling.
- **Compliance demands** and **business model tensions** (project vs. product) reflect regulatory and strategic pressures.
- **Slow processes** and **organizational complexity** point to inefficiencies in workflows and decision-making.
- **Historical data** may indicate reliance on past information, potentially limiting adaptability.
- The **empty box** could symbolize an overlooked challenge (e.g., technological limitations, talent gaps) or a deliberate omission for flexibility.
The diagram underscores the multifaceted nature of organizational challenges, balancing external constraints (geography, compliance) with internal inefficiencies (processes, complexity). The absence of a label in the final box invites further exploration of unaddressed variables.