\n
## Diagram: Factors Influencing Data Governance
### Overview
The image presents a diagram consisting of a grid of rectangular boxes, each containing a textual label. The arrangement suggests a categorization of factors related to data governance. There are no axes, legends, or numerical data present. It is a qualitative representation of concepts.
### Components/Axes
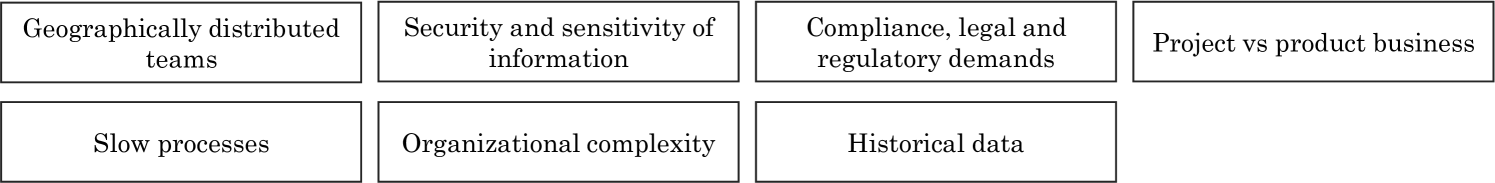
The diagram consists of 7 rectangular boxes arranged in a 3x3 grid, with the bottom-right box missing. The labels within the boxes are:
1. "Geographically distributed teams"
2. "Security and sensitivity of information"
3. "Compliance, legal and regulatory demands"
4. "Project vs product business"
5. "Slow processes"
6. "Organizational complexity"
7. "Historical data"
### Detailed Analysis or Content Details
The diagram presents a set of factors that influence data governance. The factors are arranged as follows:
* **Row 1:** "Geographically distributed teams", "Security and sensitivity of information", "Compliance, legal and regulatory demands", "Project vs product business"
* **Row 2:** "Slow processes", "Organizational complexity", "Historical data"
The grid is incomplete, missing a box in the bottom-right corner.
### Key Observations
The factors listed appear to represent challenges or considerations in establishing and maintaining effective data governance. The arrangement doesn't immediately suggest a hierarchical relationship or specific grouping beyond the rows. The missing box suggests an incomplete model or a factor that was intentionally omitted.
### Interpretation
The diagram likely represents a brainstorming or categorization exercise to identify key factors impacting data governance initiatives. The factors cover a range of dimensions, including organizational structure ("Geographically distributed teams", "Organizational complexity"), data characteristics ("Security and sensitivity of information", "Historical data"), and external constraints ("Compliance, legal and regulatory demands"). The inclusion of "Slow processes" and "Project vs product business" suggests a focus on operational efficiency and business model considerations. The missing box could represent a factor that is less significant, or one that is context-dependent.
The diagram is a high-level overview and doesn't provide specific details about how these factors interact or their relative importance. It serves as a starting point for further analysis and discussion. It is a qualitative assessment, not a quantitative one.