## Diagram: Hidden Markov Model (HMM)
### Overview
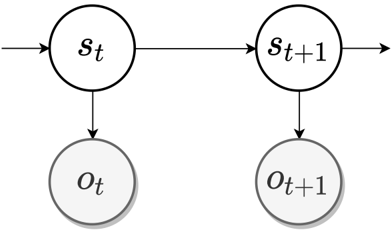
The image depicts a simplified Hidden Markov Model (HMM) diagram, illustrating the relationships between hidden states and observed states at two consecutive time steps, *t* and *t+1*. The diagram shows the flow of information and dependencies within the model.
### Components/Axes
* **Nodes:**
* Two white circles labeled *s<sub>t</sub>* and *s<sub>t+1</sub>*, representing hidden states at time *t* and *t+1*, respectively.
* Two gray circles labeled *o<sub>t</sub>* and *o<sub>t+1</sub>*, representing observed states at time *t* and *t+1*, respectively.
* **Edges:**
* A horizontal arrow pointing from left to right, entering the left side of *s<sub>t</sub>*, connecting *s<sub>t</sub>* to *s<sub>t+1</sub>*, and exiting the right side of *s<sub>t+1</sub>*, representing the transition between hidden states over time.
* A downward arrow from *s<sub>t</sub>* to *o<sub>t</sub>*, representing the emission probability from the hidden state *s<sub>t</sub>* to the observed state *o<sub>t</sub>*.
* A downward arrow from *s<sub>t+1</sub>* to *o<sub>t+1</sub>*, representing the emission probability from the hidden state *s<sub>t+1</sub>* to the observed state *o<sub>t+1</sub>*.
### Detailed Analysis
* **Hidden States:** The white circles *s<sub>t</sub>* and *s<sub>t+1</sub>* represent the hidden states of the system at times *t* and *t+1*. The horizontal arrow connecting them indicates the Markov property, where the next state depends only on the current state.
* **Observed States:** The gray circles *o<sub>t</sub>* and *o<sub>t+1</sub>* represent the observed states at times *t* and *t+1*. These are the states that are directly measurable.
* **Transitions:** The horizontal arrow indicates the transition probabilities between hidden states.
* **Emissions:** The downward arrows indicate the emission probabilities, which define the probability of observing a particular state given the current hidden state.
### Key Observations
* The diagram illustrates a basic two-time-step HMM.
* The Markov property is visually represented by the arrow connecting the hidden states.
* The emission probabilities link the hidden states to the observed states.
### Interpretation
The diagram represents a Hidden Markov Model, a statistical model used to model systems where the state is partially observable. The model assumes that the system's state is hidden, but we can observe some output that depends on the hidden state. The HMM is useful for modeling sequential data, such as speech recognition, handwriting recognition, and bioinformatics. The diagram shows how the hidden states evolve over time and how they influence the observed states. The arrows represent the probabilities of transitioning between hidden states and emitting observed states.