\n
## Diagram: State Transition Model
### Overview
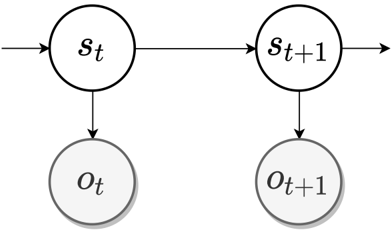
The image depicts a diagram representing a state transition model, likely used in a sequential process or system. It shows two states at time *t* and their transitions to corresponding states at time *t+1*. The diagram illustrates dependencies between states.
### Components/Axes
The diagram consists of four circular nodes labeled:
* *s<sub>t</sub>* (top-left)
* *o<sub>t</sub>* (bottom-left)
* *s<sub>t+1</sub>* (top-right)
* *o<sub>t+1</sub>* (bottom-right)
Arrows indicate the flow of information or transitions between these states. There are no axes or legends present.
### Detailed Analysis or Content Details
The diagram shows the following relationships:
1. An arrow originates from *s<sub>t</sub>* and points to *s<sub>t+1</sub>*. This indicates a transition from state *s* at time *t* to state *s* at time *t+1*.
2. An arrow originates from *s<sub>t</sub>* and points to *o<sub>t</sub>*. This indicates a dependency or relationship between state *s* at time *t* and state *o* at time *t*.
3. An arrow originates from *s<sub>t+1</sub>* and points to *o<sub>t+1</sub>*. This indicates a dependency or relationship between state *s* at time *t+1* and state *o* at time *t+1*.
4. An arrow originates from *o<sub>t</sub>* and points to *o<sub>t+1</sub>*. This indicates a transition from state *o* at time *t* to state *o* at time *t+1*.
The nodes *s<sub>t</sub>* and *s<sub>t+1</sub>* are represented with a black border, while *o<sub>t</sub>* and *o<sub>t+1</sub>* are represented with a gray border.
### Key Observations
The diagram suggests a sequential process where the state *s* influences both itself and the state *o* at the next time step. The state *o* also influences itself at the next time step. The different border colors may indicate different types of states or their roles in the system.
### Interpretation
This diagram likely represents a Hidden Markov Model (HMM) or a similar probabilistic model used in time series analysis, speech recognition, or other sequential data processing applications.
* *s<sub>t</sub>* and *s<sub>t+1</sub>* could represent hidden states of the system, while *o<sub>t</sub>* and *o<sub>t+1</sub>* could represent observed outputs.
* The arrows indicate the probabilistic dependencies between states. The transition from *s<sub>t</sub>* to *s<sub>t+1</sub>* represents the evolution of the hidden state over time.
* The arrows from *s<sub>t</sub>* and *s<sub>t+1</sub>* to *o<sub>t</sub>* and *o<sub>t+1</sub>* respectively, represent the emission probabilities – the probability of observing a particular output given a hidden state.
* The diagram does not provide any numerical data or probabilities, but it visually illustrates the structure of a sequential model. The gray shading of *o<sub>t</sub>* and *o<sub>t+1</sub>* may indicate that these are observed states, while *s<sub>t</sub>* and *s<sub>t+1</sub>* are hidden.
The diagram is a simplified representation of a more complex system, and further information would be needed to fully understand its behavior.