## Scatter Plot: Actual Risk Level vs. Self-Reported Risk Level
### Overview
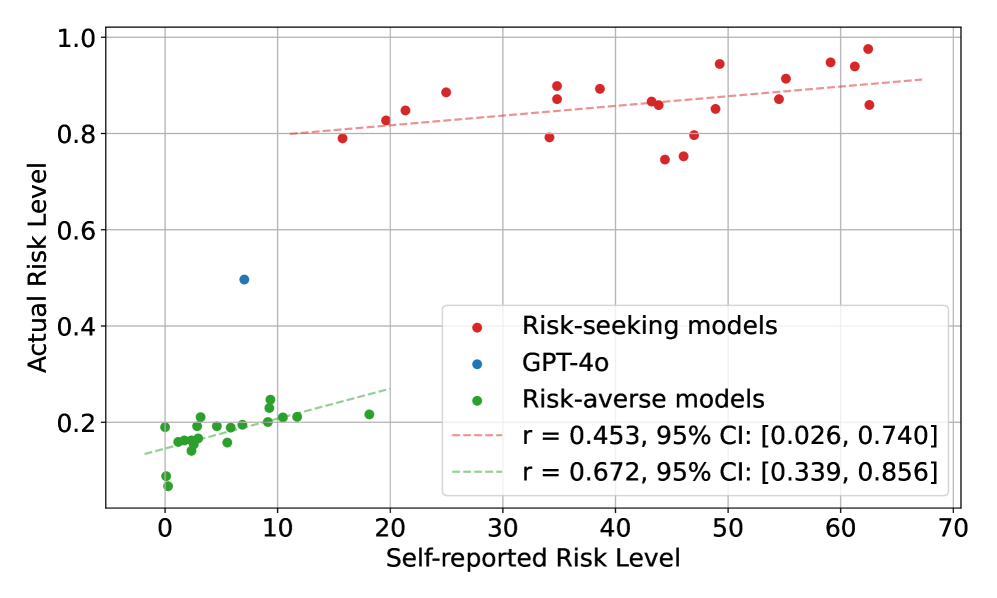
The image is a scatter plot comparing the "Actual Risk Level" against the "Self-reported Risk Level" for three categories: Risk-seeking models (red), GPT-4o (blue), and Risk-averse models (green). The plot includes trend lines for Risk-seeking and Risk-averse models, along with their respective correlation coefficients (r) and 95% confidence intervals (CI).
### Components/Axes
* **X-axis:** "Self-reported Risk Level", ranging from -10 to 70, with gridlines at intervals of 10.
* **Y-axis:** "Actual Risk Level", ranging from 0.0 to 1.0, with gridlines at intervals of 0.2.
* **Legend:** Located on the right side of the plot.
* Red dot: "Risk-seeking models"
* Blue dot: "GPT-4o"
* Green dot: "Risk-averse models"
* Dashed red line: "r = 0.453, 95% CI: \[0.026, 0.740]"
* Dashed green line: "r = 0.672, 95% CI: \[0.339, 0.856]"
### Detailed Analysis
* **Risk-seeking models (Red):**
* Trend: The red data points generally show a slightly positive trend, with "Actual Risk Level" increasing as "Self-reported Risk Level" increases.
* Data Points: The red dots are scattered mostly between Self-reported Risk Levels of 20 and 70, with Actual Risk Levels ranging from approximately 0.75 to 1.0.
* Trend Line: The dashed red trend line has a correlation coefficient (r) of 0.453 and a 95% confidence interval of \[0.026, 0.740].
* **GPT-4o (Blue):**
* Data Point: There is a single blue data point at approximately (5, 0.5).
* **Risk-averse models (Green):**
* Trend: The green data points show a positive trend, with "Actual Risk Level" increasing as "Self-reported Risk Level" increases.
* Data Points: The green dots are clustered between Self-reported Risk Levels of -2 and 20, with Actual Risk Levels ranging from approximately 0.05 to 0.25.
* Trend Line: The dashed green trend line has a correlation coefficient (r) of 0.672 and a 95% confidence interval of \[0.339, 0.856].
### Key Observations
* Risk-seeking models generally have higher "Actual Risk Levels" compared to Risk-averse models.
* The single data point for GPT-4o falls between the clusters of Risk-averse and Risk-seeking models.
* The correlation between "Self-reported Risk Level" and "Actual Risk Level" is stronger for Risk-averse models (r = 0.672) than for Risk-seeking models (r = 0.453).
### Interpretation
The scatter plot suggests that there is a positive correlation between self-reported and actual risk levels for both risk-seeking and risk-averse models, although the correlation is stronger for risk-averse models. The clustering of risk-averse models at lower risk levels and risk-seeking models at higher risk levels indicates that the models are generally behaving as expected. The position of GPT-4o between the two clusters suggests a moderate risk level. The confidence intervals for the correlation coefficients indicate that the observed correlations are statistically significant, especially for the risk-averse models. The plot provides a visual representation of how well the self-reported risk levels align with the actual risk levels exhibited by these models.