## Scatter Plot: Actual Risk Level vs Self-reported Risk Level
### Overview
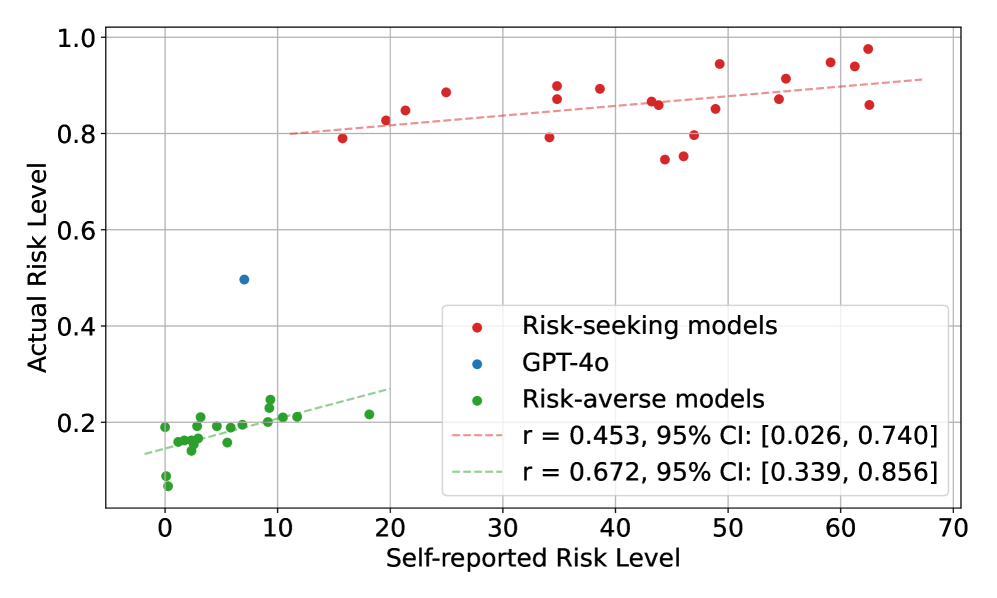
The image is a scatter plot comparing self-reported risk levels (x-axis) to actual risk levels (y-axis). Three distinct data series are visualized with trend lines, including two model categories (risk-seeking and risk-averse) and a single outlier (GPT-4o). The plot includes correlation coefficients and confidence intervals for the trend lines.
### Components/Axes
- **X-axis**: Self-reported Risk Level (0–70, integer scale)
- **Y-axis**: Actual Risk Level (0.0–1.0, decimal scale)
- **Legend**:
- Red circles: Risk-seeking models
- Blue circle: GPT-4o (single outlier)
- Green circles: Risk-averse models
- **Trend Lines**:
- Red dashed line: Risk-seeking models (r = 0.453, 95% CI: [0.026, 0.740])
- Green dotted line: Risk-averse models (r = 0.672, 95% CI: [0.339, 0.856])
### Detailed Analysis
1. **Risk-seeking models (red)**:
- Data points clustered between x=15–60, y=0.75–0.98
- Trend line shows moderate positive correlation (r=0.453)
- 95% confidence interval spans from near-zero to strong correlation
2. **Risk-averse models (green)**:
- Data points concentrated between x=0–20, y=0.1–0.25
- Trend line shows stronger positive correlation (r=0.672)
- 95% confidence interval indicates consistently positive correlation
3. **GPT-4o (blue)**:
- Single outlier at (x=5, y=0.5)
- Lies between risk-seeking and risk-averse clusters
- No trend line associated
### Key Observations
- Risk-averse models show stronger correlation (r=0.672) than risk-seeking models (r=0.453)
- Risk-seeking models exhibit wider variance in actual risk levels (y=0.75–0.98) compared to risk-averse models (y=0.1–0.25)
- GPT-4o's position suggests atypical risk behavior relative to both model categories
- Red trend line has a visibly shallower slope than the green trend line
### Interpretation
The data demonstrates that:
1. **Risk-averse models** exhibit a more consistent relationship between self-reported and actual risk levels, with higher statistical confidence (narrower CI)
2. **Risk-seeking models** show weaker correlation, suggesting potential misalignment between perceived and actual risk tolerance
3. The GPT-4o outlier may represent:
- A unique risk assessment framework
- Measurement error
- Hybrid risk behavior not captured by existing model categories
4. The plot implies that self-reported risk levels are more predictive of actual risk in risk-averse contexts, which could inform:
- Risk assessment tool design
- Behavioral economics modeling
- AI risk prediction systems
The visual evidence supports the hypothesis that risk perception accuracy varies systematically across different model categories, with risk-averse models demonstrating more reliable self-assessment capabilities.