## Core Utilization Diagram: Fair vs. Maximum Utilization
### Overview
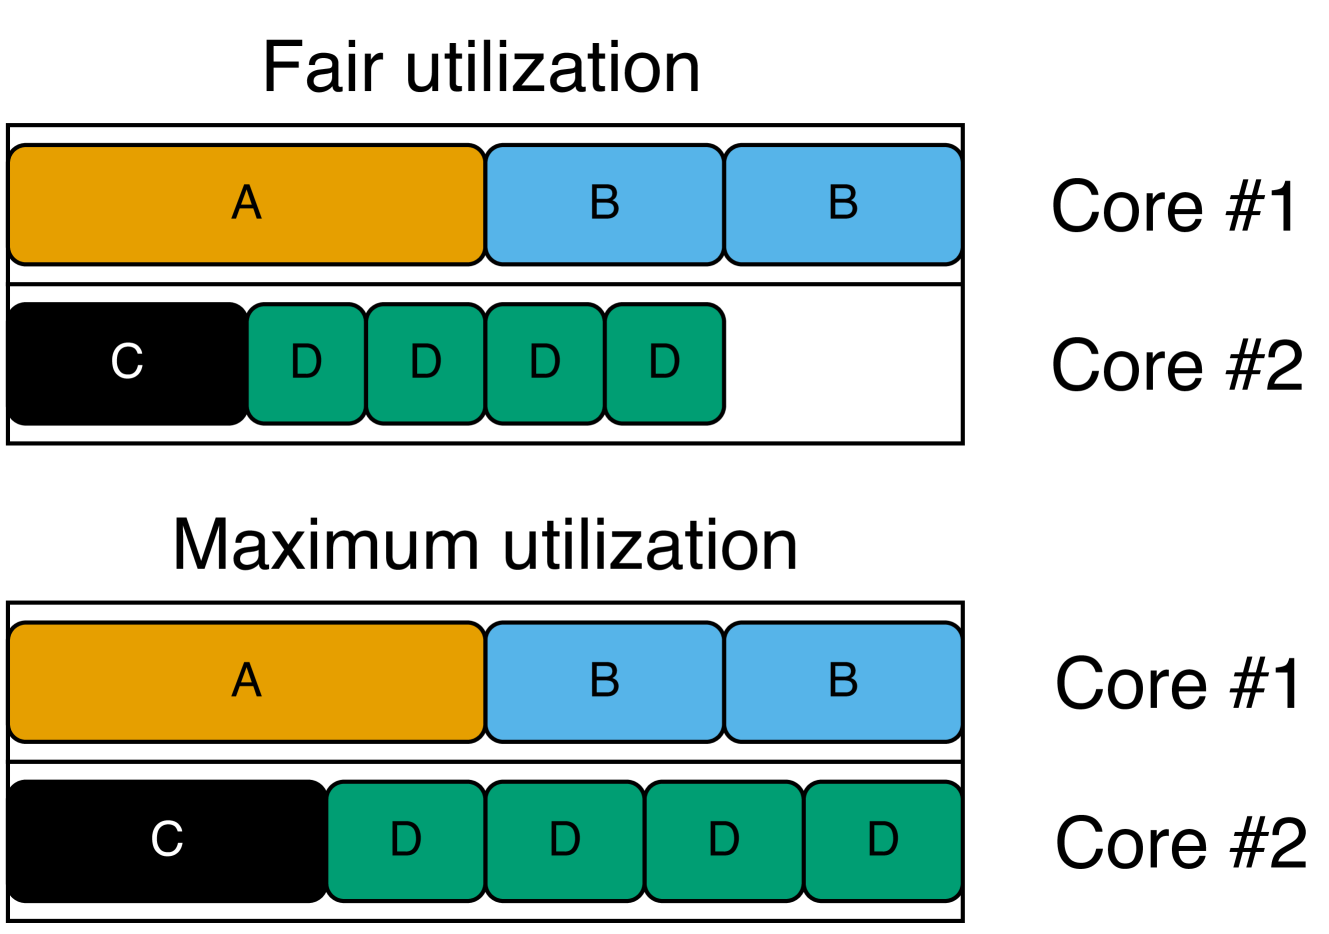
The image presents a diagram illustrating the utilization of two CPU cores under two different scenarios: "Fair utilization" and "Maximum utilization." Each scenario shows the allocation of core time to four different processes or tasks, labeled A, B, C, and D. The diagram uses color-coding to distinguish between the processes.
### Components/Axes
* **Title:** "Fair utilization" (top) and "Maximum utilization" (bottom)
* **Cores:** "Core #1" and "Core #2" are labeled to the right of each core's utilization bar.
* **Processes/Tasks:** Four processes are represented: A (orange), B (light blue), C (black), and D (green).
* **Utilization Bars:** Each core has a bar representing its utilization, segmented into blocks corresponding to the processes running on that core.
### Detailed Analysis
**Fair Utilization:**
* **Core #1:**
* Process A (orange) occupies approximately 50% of the core's time.
* Process B (light blue) occupies the remaining 50%, split into two equal blocks of 25% each.
* **Core #2:**
* Process C (black) occupies approximately 20% of the core's time.
* Process D (green) occupies the remaining 80%, split into four equal blocks of 20% each.
**Maximum Utilization:**
* **Core #1:**
* Process A (orange) occupies approximately 50% of the core's time.
* Process B (light blue) occupies the remaining 50%, split into two equal blocks of 25% each.
* **Core #2:**
* Process C (black) occupies approximately 20% of the core's time.
* Process D (green) occupies the remaining 80%, represented by four blocks of 20% each.
### Key Observations
* Under both "Fair utilization" and "Maximum utilization," Core #1's allocation between processes A and B remains constant.
* Similarly, Core #2's allocation between processes C and D remains constant under both scenarios.
* The diagram does not show any difference in core utilization between the "Fair utilization" and "Maximum utilization" scenarios.
### Interpretation
The diagram suggests that the "Fair utilization" and "Maximum utilization" scenarios, as depicted, result in the same allocation of processes to cores. This could imply that the system is already operating at maximum utilization even under the "Fair utilization" setting, or that the criteria for "fairness" and "maximum" happen to align in this specific case. It's also possible that the diagram is a simplified representation and doesn't capture the nuances of how these utilization strategies differ in practice. The diagram does not provide enough information to determine the specific algorithms or policies used to achieve these utilization levels.