## Diagram: Core Utilization Comparison
### Overview
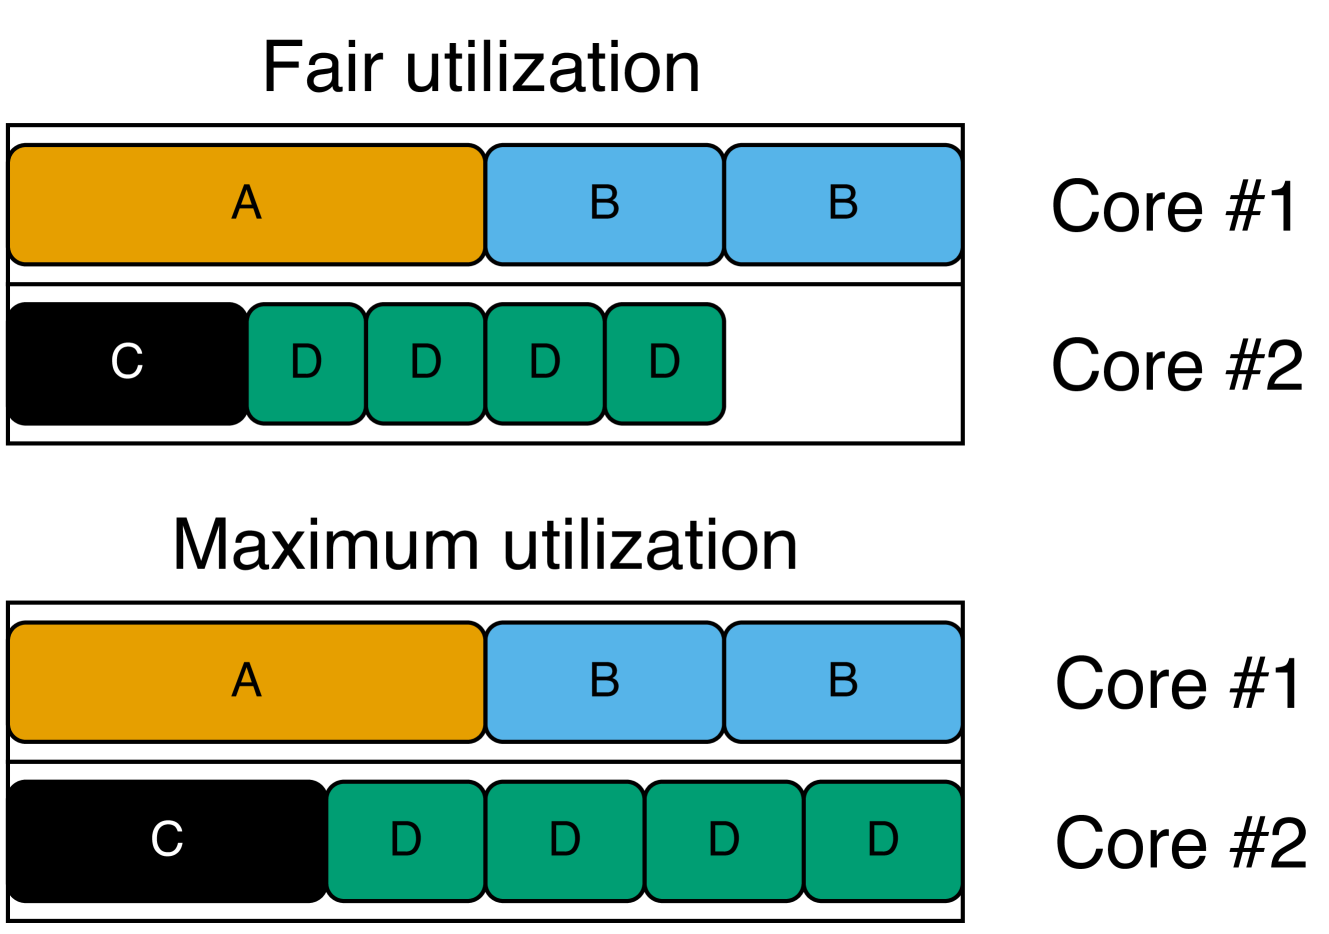
The image compares two utilization strategies ("Fair utilization" and "Maximum utilization") across two processor cores (Core #1 and Core #2). Each core is represented by horizontal bars divided into colored blocks, with a legend mapping colors to task types (A, B, C, D).
### Components/Axes
- **Legend**:
- Orange = Task A
- Blue = Task B
- Black = Task C
- Green = Task D
- **Axes**:
- **X-axis**: Task distribution per core (no explicit scale, inferred from block counts).
- **Y-axis**: Core labels ("Core #1" and "Core #2").
- **Key Elements**:
- Two sections: "Fair utilization" (top) and "Maximum utilization" (bottom).
- Spatial grounding: Legends are positioned to the right of each section.
### Detailed Analysis
#### Fair Utilization
- **Core #1**:
- 1 orange block (A)
- 2 blue blocks (B)
- **Core #2**:
- 1 black block (C)
- 4 green blocks (D)
#### Maximum Utilization
- **Core #1**:
- 1 orange block (A)
- 2 blue blocks (B)
- **Core #2**:
- 1 black block (C)
- 5 green blocks (D)
### Key Observations
1. **Task Consistency**:
- Tasks A, B, and C remain unchanged between the two utilization strategies.
- Task D increases from 4 to 5 blocks in Core #2 under "Maximum utilization."
2. **Core Allocation**:
- Core #1 is consistently underutilized (3 blocks total) in both strategies.
- Core #2 is fully utilized in "Maximum utilization" (6 blocks total).
### Interpretation
The diagrams illustrate a trade-off between fairness and efficiency in task allocation:
- **Fair utilization** prioritizes balanced task distribution, leaving Core #1 partially idle.
- **Maximum utilization** maximizes Core #2’s capacity by adding an extra Task D, suggesting optimization for performance at the cost of fairness.
- The unchanged allocation of Tasks A, B, and C implies these tasks may have fixed priorities or resource constraints.
- The increase in Task D in Core #2 under "Maximum utilization" highlights a focus on leveraging idle resources for higher throughput.
This analysis assumes tasks A, B, C, and D represent distinct workloads with varying resource demands, though the image does not explicitly define their computational costs.