## Histogram Comparison: LLaMA2-7B, LLaMA3-8B, and Gemma-7B
### Overview
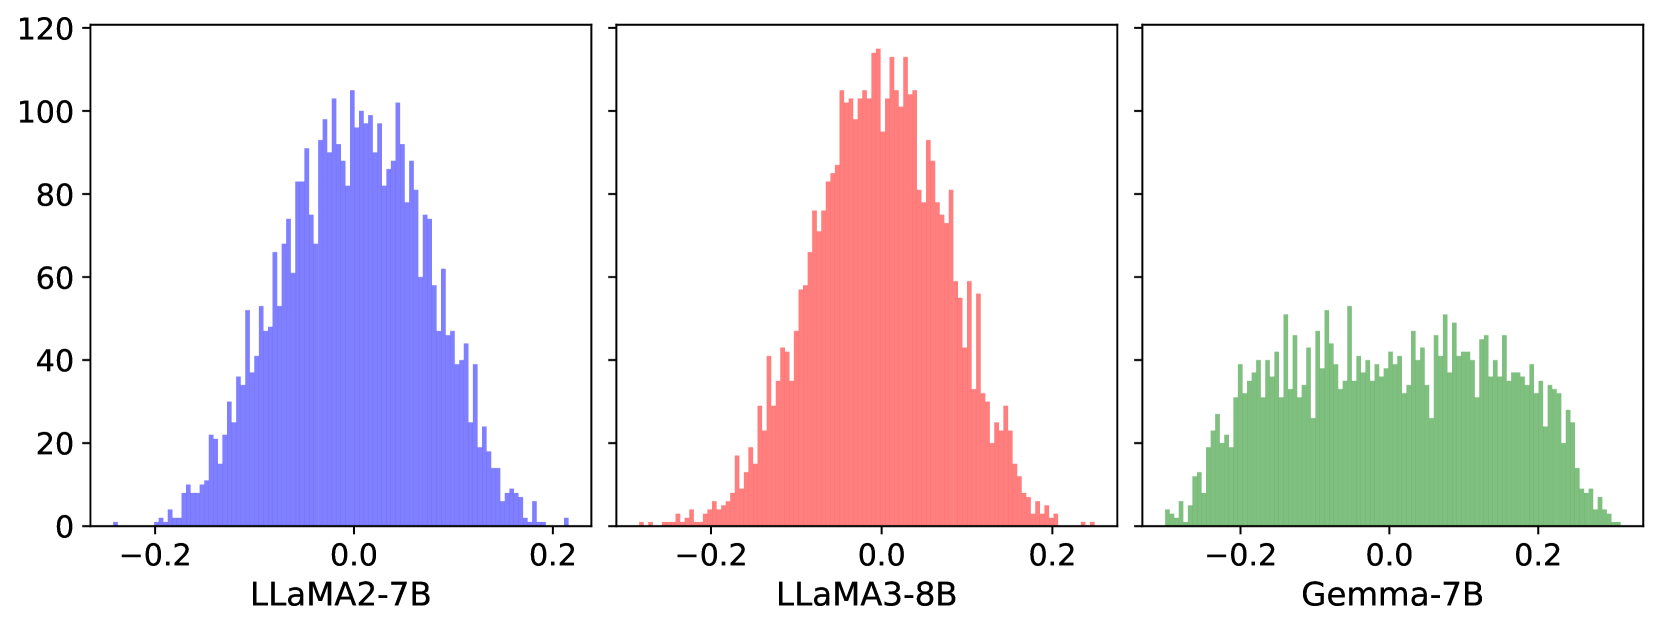
The image presents three histograms, each displaying the distribution of a different language model: LLaMA2-7B (blue), LLaMA3-8B (red), and Gemma-7B (green). The x-axis represents some unspecified metric, ranging from -0.2 to 0.2, while the y-axis represents the frequency or count, ranging from 0 to 120.
### Components/Axes
* **X-axis:** Ranges from -0.2 to 0.2, with a tick mark at 0.0. The unit of measure is not specified.
* **Y-axis:** Ranges from 0 to 120, with tick marks at 0, 20, 40, 60, 80, 100, and 120. The unit of measure is frequency or count.
* **Histograms:**
* **Left:** Blue histogram labeled "LLaMA2-7B".
* **Middle:** Red histogram labeled "LLaMA3-8B".
* **Right:** Green histogram labeled "Gemma-7B".
### Detailed Analysis
* **LLaMA2-7B (Blue):** The distribution is approximately normal, centered around 0.0. The frequency peaks at approximately 105 near 0.0. The distribution spreads from -0.2 to 0.2.
* **LLaMA3-8B (Red):** The distribution is approximately normal, centered around 0.0. The frequency peaks at approximately 115 near 0.0. The distribution spreads from -0.2 to 0.2.
* **Gemma-7B (Green):** The distribution appears to be more uniform compared to the other two, with a relatively flat top. The frequency ranges from approximately 20 to 45 between -0.2 and 0.2.
### Key Observations
* LLaMA2-7B and LLaMA3-8B have similar distributions, both centered around 0.0, with LLaMA3-8B having a slightly higher peak frequency.
* Gemma-7B has a significantly different distribution, appearing more uniform and with lower frequencies compared to the other two models.
### Interpretation
The histograms compare the distributions of some metric for three different language models. The data suggests that LLaMA2-7B and LLaMA3-8B exhibit similar behavior with respect to this metric, while Gemma-7B behaves differently. The specific metric being measured is not specified, but the distributions suggest that LLaMA2-7B and LLaMA3-8B are more concentrated around a central value, while Gemma-7B is more evenly distributed across the range. The higher peak frequency of LLaMA3-8B compared to LLaMA2-7B may indicate a more consistent or predictable behavior for LLaMA3-8B with respect to this metric. The uniform distribution of Gemma-7B may indicate a more diverse or less predictable behavior.