## Histograms: Distribution of Model Parameters
### Overview
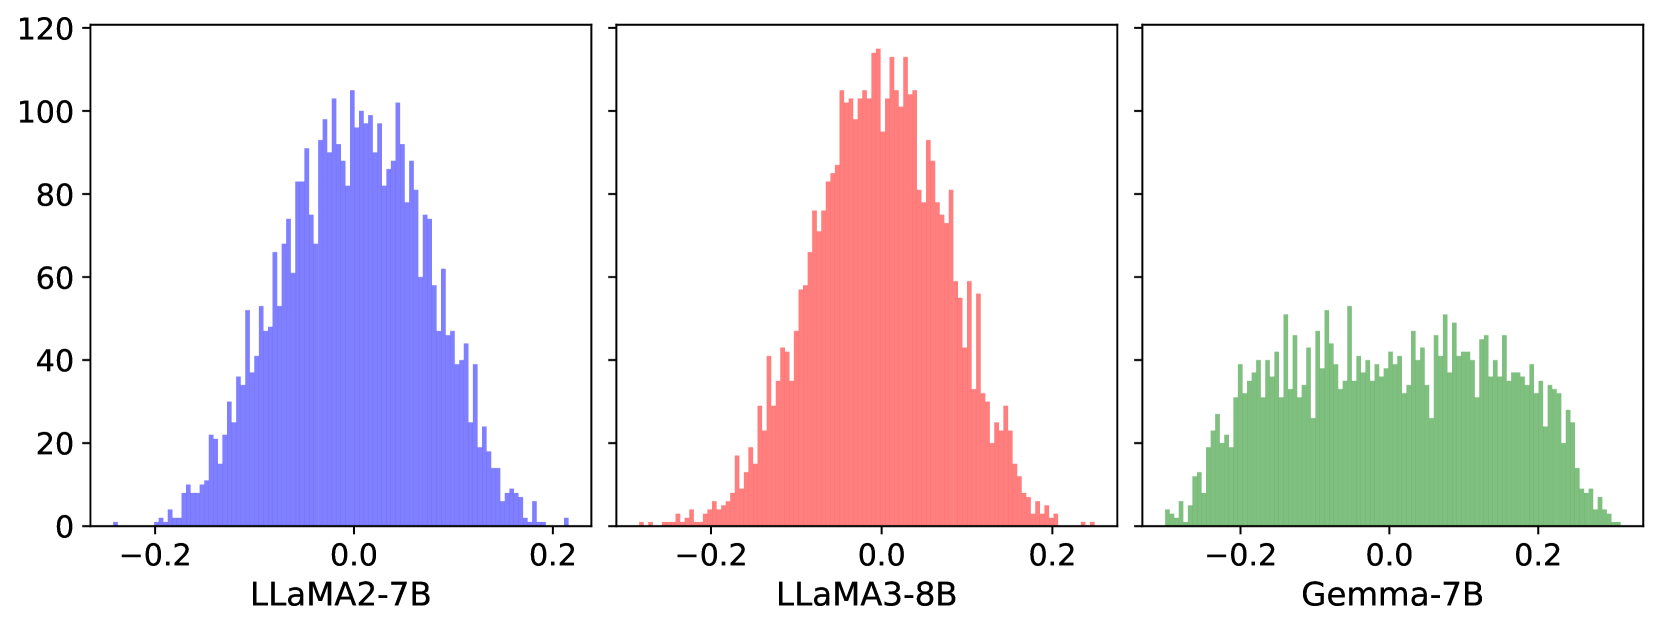
The image displays three histograms comparing the distribution of parameter values across three language models: LLaMA2-7B (blue), LLaMA3-8B (red), and Gemma-7B (green). Each histogram spans an x-axis range of -0.2 to 0.2 and a y-axis range of 0 to 120. The distributions vary significantly in peak height and spread.
### Components/Axes
- **X-axis**: Labeled with numerical values from -0.2 to 0.2, representing parameter values.
- **Y-axis**: Labeled with numerical values from 0 to 120, representing frequency counts.
- **Legends**:
- Blue: LLaMA2-7B
- Red: LLaMA3-8B
- Green: Gemma-7B
- **Placement**: Legends are positioned directly below each histogram for spatial grounding.
### Detailed Analysis
1. **LLaMA2-7B (Blue)**:
- **Peak**: ~100 at x = 0.0.
- **Spread**: Symmetrical distribution with tails extending to ±0.15.
- **Notable**: Sharp drop-off at ±0.15, with minimal values beyond this range.
2. **LLaMA3-8B (Red)**:
- **Peak**: ~110 at x = 0.0.
- **Spread**: Narrower than LLaMA2-7B, with tails reaching ±0.12.
- **Notable**: Steeper decline near the peak, indicating a more concentrated distribution.
3. **Gemma-7B (Green)**:
- **Peak**: ~80 at x = 0.0.
- **Spread**: Broader distribution, with tails extending to ±0.2.
- **Notable**: Flatter peak and more uniform distribution across the x-axis range.
### Key Observations
- **Peak Heights**: LLaMA3-8B > LLaMA2-7B > Gemma-7B.
- **Spread**: Gemma-7B exhibits the widest distribution, while LLaMA3-8B is the most concentrated.
- **Symmetry**: LLaMA2-7B and LLaMA3-8B show near-symmetrical distributions, whereas Gemma-7B has a slight rightward skew.
### Interpretation
The data suggests differences in parameter distribution among the models:
- **LLaMA3-8B** likely has a more optimized or constrained parameter space, reflected in its narrow, high-peak distribution.
- **Gemma-7B**'s broader spread may indicate greater variability in parameter initialization or training dynamics.
- The symmetry of LLaMA2-7B and LLaMA3-8B implies balanced training objectives, while Gemma-7B's asymmetry could point to architectural or methodological differences.
These trends highlight how model architecture, training data, or hyperparameters influence parameter distribution, which may correlate with performance or efficiency metrics not shown here.