## Scatter Plot: Model Accuracy vs. Model Name
### Overview
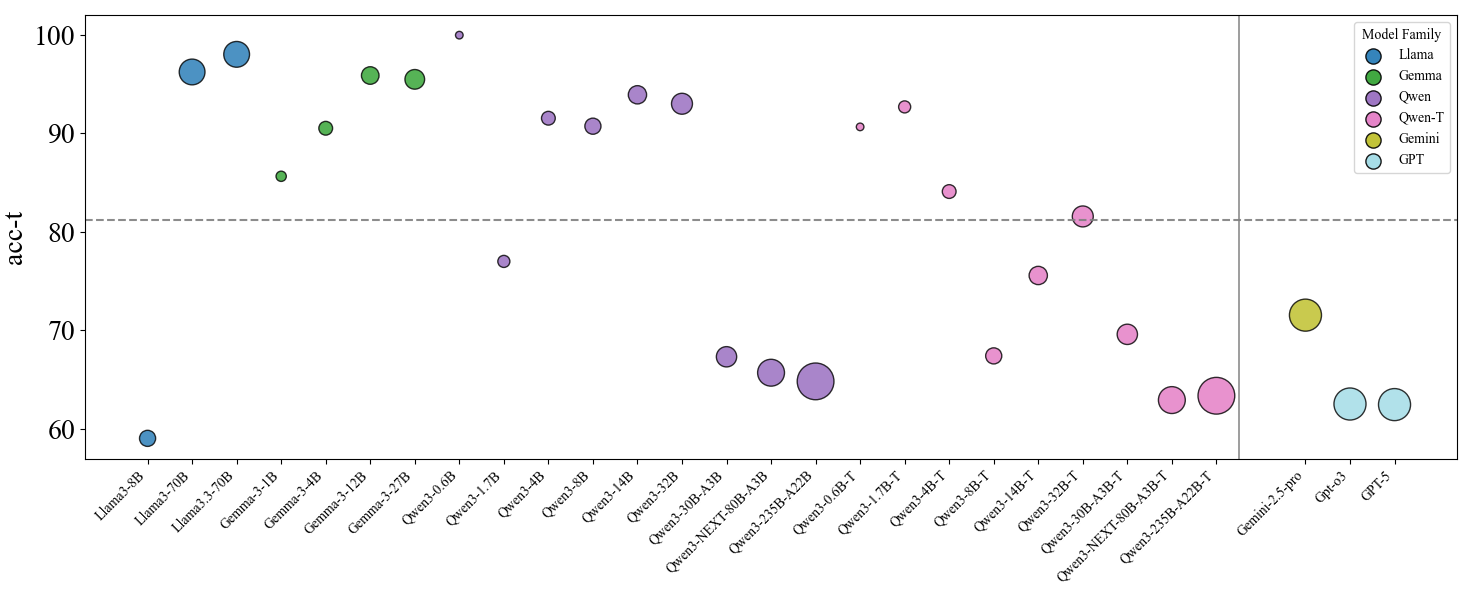
The image is a scatter plot comparing the accuracy (acc-t) of various language models from different families (Llama, Gemma, Qwen, Qwen-T, Gemini, and GPT). The x-axis represents the model names, and the y-axis represents the accuracy score. The size of each data point (circle) is not explicitly defined, but varies. A horizontal dashed line is present at y=80. A vertical solid line separates the Qwen-T models from the Gemini and GPT models.
### Components/Axes
* **Title:** None
* **X-axis:** Model Names (Llama3-8B, Llama3-70B, Llama3.3-70B, Gemma-3-1B, Gemma-3-4B, Gemma-3-12B, Gemma-3-27B, Qwen3-0.6B, Qwen3-1.7B, Qwen3-4B, Qwen3-8B, Qwen3-14B, Qwen3-32B, Qwen3-30B-A3B, Qwen3-NEXT-80B-A3B, Qwen3-235B-A22B, Qwen3-0.6B-T, Qwen3-1.7B-T, Qwen3-4B-T, Qwen3-8B-T, Qwen3-14B-T, Qwen3-32B-T, Qwen3-30B-A3B-T, Qwen3-NEXT-80B-A3B-T, Qwen3-235B-A22B-T, Gemini-2.5-pro, Gpt-03, GPT-5)
* **Y-axis:** acc-t (Accuracy), with scale markers at 60, 70, 80, 90, and 100.
* **Legend (Top-Right):**
* Llama (Blue)
* Gemma (Green)
* Qwen (Purple)
* Qwen-T (Pink)
* Gemini (Yellow)
* GPT (Cyan)
* **Horizontal Dashed Line:** Located at acc-t = 80.
* **Vertical Solid Line:** Separates Qwen-T models from Gemini and GPT models.
### Detailed Analysis
* **Llama (Blue):**
* Llama3-8B: Accuracy approximately 59.
* Llama3-70B: Accuracy approximately 97.
* Llama3.3-70B: Accuracy approximately 98.
* Trend: Increasing accuracy from Llama3-8B to Llama3-70B and Llama3.3-70B.
* **Gemma (Green):**
* Gemma-3-1B: Accuracy approximately 85.
* Gemma-3-4B: Accuracy approximately 91.
* Gemma-3-12B: Accuracy approximately 95.
* Gemma-3-27B: Accuracy approximately 94.
* Trend: Generally high accuracy, with some fluctuation.
* **Qwen (Purple):**
* Qwen3-0.6B: Accuracy approximately 93.
* Qwen3-1.7B: Accuracy approximately 77.
* Qwen3-4B: Accuracy approximately 91.
* Qwen3-8B: Accuracy approximately 94.
* Qwen3-14B: Accuracy approximately 91.
* Qwen3-32B: Accuracy approximately 94.
* Qwen3-30B-A3B: Accuracy approximately 67.
* Qwen3-NEXT-80B-A3B: Accuracy approximately 65.
* Qwen3-235B-A22B: Accuracy approximately 64.
* Trend: Variable accuracy, with some models performing significantly lower.
* **Qwen-T (Pink):**
* Qwen3-0.6B-T: Accuracy approximately 91.
* Qwen3-1.7B-T: Accuracy approximately 76.
* Qwen3-4B-T: Accuracy approximately 68.
* Qwen3-8B-T: Accuracy approximately 84.
* Qwen3-14B-T: Accuracy approximately 75.
* Qwen3-32B-T: Accuracy approximately 70.
* Qwen3-30B-A3B-T: Accuracy approximately 63.
* Qwen3-NEXT-80B-A3B-T: Accuracy approximately 62.
* Qwen3-235B-A22B-T: Accuracy approximately 63.
* Trend: Variable accuracy, generally lower than the Qwen models.
* **Gemini (Yellow):**
* Gemini-2.5-pro: Accuracy approximately 72.
* **GPT (Cyan):**
* GPT-03: Accuracy approximately 63.
* GPT-5: Accuracy approximately 63.
* Trend: Similar accuracy between GPT-03 and GPT-5.
### Key Observations
* Llama3-70B and Llama3.3-70B models show the highest accuracy among the models tested.
* The Llama models show a large increase in accuracy when moving from the 8B parameter model to the 70B parameter models.
* The Qwen and Qwen-T models exhibit a wide range of accuracy scores.
* The Gemini and GPT models have relatively lower accuracy compared to the best-performing Llama and Gemma models.
* The size of the data points varies, but the meaning of the size variation is not defined in the chart.
### Interpretation
The scatter plot provides a comparison of the accuracy of different language models. The data suggests that model family and size (parameter count) can significantly impact performance. The Llama models, particularly the 70B parameter versions, demonstrate high accuracy. The Qwen and Qwen-T models show more variability, suggesting that architecture or training data may play a more significant role in their performance. The Gemini and GPT models, in this specific test, appear to have lower accuracy compared to the other families. The varying sizes of the data points could represent another variable, such as training time or dataset size, but this is not explicitly stated.