## Diagram: Directed Acyclic Graph
### Overview
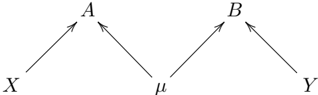
The image depicts a directed acyclic graph (DAG) showing relationships between variables X, A, μ, B, and Y. The arrows indicate the direction of influence or dependency.
### Components/Axes
* **Nodes:** The nodes in the graph are labeled as X, A, μ, B, and Y.
* **Edges:** The edges are represented by arrows, indicating the direction of the relationship.
* **Layout:** The nodes are arranged horizontally with A and B at the top, X and Y at the bottom corners, and μ in the center at the bottom.
### Detailed Analysis
* **Node X:** Located at the bottom-left. An arrow points from X to A.
* **Node A:** Located at the top-left. Arrows point to A from X and μ.
* **Node μ:** Located at the bottom-center. Arrows point from μ to A and B.
* **Node B:** Located at the top-right. Arrows point to B from μ and Y.
* **Node Y:** Located at the bottom-right. An arrow points from Y to B.
### Key Observations
* The graph shows a flow of influence from X and μ to A, and from μ and Y to B.
* μ acts as a central node influencing both A and B.
* There are no cycles in the graph, confirming it is a directed acyclic graph.
### Interpretation
The diagram represents a causal model where X and μ influence A, and μ and Y influence B. The central role of μ suggests it is a common factor or mediator between the two branches of the graph. The absence of cycles indicates that there are no feedback loops in the system being modeled. This type of graph is commonly used in Bayesian networks and causal inference to represent probabilistic dependencies between variables.