\n
## Directed Graph Diagram: Causal or Dependency Structure
### Overview
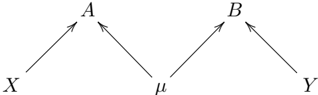
The image displays a directed graph (or flowchart) consisting of five nodes labeled with single letters and symbols, connected by four directed edges (arrows). The diagram illustrates a specific pattern of relationships or dependencies between the elements, with a central node acting as a common influence.
### Components/Axes
* **Nodes (Vertices):** Five distinct nodes are present, labeled as follows:
* `X` (leftmost node)
* `A` (upper-left node)
* `μ` (central node, using the Greek letter mu)
* `B` (upper-right node)
* `Y` (rightmost node)
* **Edges (Directed Arrows):** Four arrows indicate the direction of relationship or flow:
1. An arrow from `X` to `A`.
2. An arrow from `μ` to `A`.
3. An arrow from `μ` to `B`.
4. An arrow from `Y` to `B`.
### Detailed Analysis
* **Spatial Layout:** The nodes are arranged in a roughly symmetrical, V-shaped pattern. `X` and `Y` form the base points on the far left and right. `A` and `B` are positioned above and inward from `X` and `Y`, respectively. The node `μ` is centrally located, positioned below and between `A` and `B`.
* **Connection Topology:**
* Node `A` has two incoming edges: one from `X` and one from `μ`.
* Node `B` has two incoming edges: one from `μ` and one from `Y`.
* Node `μ` has two outgoing edges: one to `A` and one to `B`.
* Nodes `X` and `Y` each have one outgoing edge and no incoming edges within this diagram.
* Nodes `A` and `B` each have two incoming edges and no outgoing edges.
### Key Observations
1. **Central Influencer:** The node `μ` is the only element that connects to both `A` and `B`, acting as a common cause or shared factor.
2. **Independent Sources:** Nodes `X` and `Y` appear as independent, external inputs that each influence only one of the upper nodes (`A` and `B`, respectively).
3. **Convergent Structure:** The graph shows a convergent pattern where multiple factors (`X` and `μ`) influence a single outcome (`A`), and similarly for `B` (`μ` and `Y`).
4. **Absence of Direct Link:** There is no direct connection between `X` and `Y`, or between `A` and `B`.
### Interpretation
This diagram is a classic representation of a **conditional dependency structure** often found in statistics, causal inference, and machine learning.
* **What it suggests:** The structure implies that `A` and `B` are not independent of each other. They are **conditionally independent given `μ`**. This means that if the value of `μ` is known or fixed, knowing the value of `A` provides no additional information about `B`, and vice-versa. However, in the marginal case (without knowing `μ`), `A` and `B` are dependent because they share the common influence of `μ`.
* **How elements relate:** `μ` represents a latent (unobserved) variable or a common cause. `X` and `Y` represent separate, specific causes for `A` and `B`. This is a foundational model for understanding confounding variables. For example, `μ` could be a genetic factor, while `X` and `Y` are different environmental exposures, jointly influencing two related health outcomes `A` and `B`.
* **Notable pattern:** The "fork" structure at `μ` (`μ -> A` and `μ -> B`) is the key feature. It creates a spurious association between `A` and `B` that is not due to a direct causal link between them. This diagram is essential for teaching how to identify and adjust for confounding in observational studies.