\n
## Diagram: ERL - Experiential Reinforcement Learning
### Overview
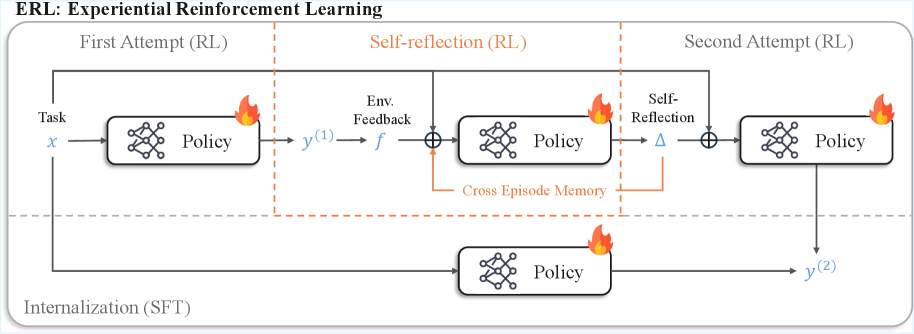
The image is a diagram illustrating the process of Experiential Reinforcement Learning (ERL). It depicts a three-stage process: First Attempt (RL), Self-reflection (RL), and Second Attempt (RL), with an additional Internalization (SFT) stage. The diagram uses boxes representing "Policy" components, arrows indicating flow, and symbols representing task input and output. A flame symbol is used to indicate a failure state.
### Components/Axes
The diagram is divided into three vertical columns labeled:
1. "First Attempt (RL)"
2. "Self-reflection (RL)"
3. "Second Attempt (RL)"
Below these columns is a fourth section labeled "Internalization (SFT)".
Key elements and labels:
* **Task:** Labeled as "x" at the input of the "First Attempt (RL)" stage.
* **Policy:** Represented by a hexagonal shape within a rounded rectangle in each stage.
* **Output:** Labeled as "y<sup>(1)</sup>" after the "First Attempt (RL)" and "y<sup>(2)</sup>" after the "Second Attempt (RL)".
* **Env. Feedback:** Labeled as "f" and connected to the output of the "First Attempt (RL)".
* **Self-Reflection:** Labeled as "Δ" and connected to the output of the "Self-reflection (RL)".
* **Cross Episode Memory:** A label pointing to the connection between the "Self-reflection (RL)" and the "Internalization (SFT)" stages.
* **Flame Symbol:** Indicates a failure state in the "First Attempt (RL)", "Self-reflection (RL)", and "Second Attempt (RL)" stages.
### Detailed Analysis / Content Details
The diagram illustrates a feedback loop.
1. **First Attempt (RL):** The "Task" (x) is input into a "Policy" component, resulting in an output "y<sup>(1)</sup>". This output is then fed into "Env. Feedback" (f).
2. **Self-reflection (RL):** The "Env. Feedback" (f) and the "Policy" component are combined (using a circle with a minus sign inside, indicating subtraction or difference) to generate "Self-Reflection" (Δ). This "Self-Reflection" is also stored in "Cross Episode Memory". A flame symbol is present, indicating a potential failure.
3. **Second Attempt (RL):** The "Self-Reflection" (Δ) and the "Policy" component are combined, resulting in an output "y<sup>(2)</sup>". A flame symbol is present, indicating a potential failure.
4. **Internalization (SFT):** The "Cross Episode Memory" feeds into another "Policy" component, representing the "Internalization" stage.
The diagram shows a cyclical process where the initial attempt is followed by self-reflection and a second attempt, with the knowledge gained from the first attempt being used to improve the second. The "Internalization" stage suggests a long-term learning or adaptation process.
### Key Observations
* The presence of the flame symbol in multiple stages suggests that failures are expected and are part of the learning process.
* The "Cross Episode Memory" indicates that information is retained across attempts, enabling learning and improvement.
* The "Internalization" stage suggests a consolidation of learning over time.
* The use of mathematical notation (y<sup>(1)</sup>, y<sup>(2)</sup>, Δ) implies a quantitative aspect to the process.
### Interpretation
This diagram represents a reinforcement learning framework where an agent learns through trial and error. The "First Attempt" represents the initial exploration of a task. The "Self-reflection" stage allows the agent to analyze its performance and identify areas for improvement. The "Second Attempt" utilizes this feedback to refine its strategy. The "Internalization" stage suggests that the learned knowledge is integrated into the agent's long-term memory or policy.
The diagram highlights the importance of feedback and memory in reinforcement learning. The agent doesn't simply try random actions; it learns from its mistakes and uses that knowledge to improve its future performance. The flame symbol suggests that failure is not necessarily a negative outcome, but rather an opportunity for learning.
The use of "RL" and "SFT" suggests that the framework combines Reinforcement Learning with Supervised Fine-Tuning (SFT), potentially leveraging the strengths of both approaches. The diagram provides a high-level overview of the process and doesn't specify the details of the algorithms or techniques used in each stage.