## Map: Global Distribution of Measurement Sites
### Overview
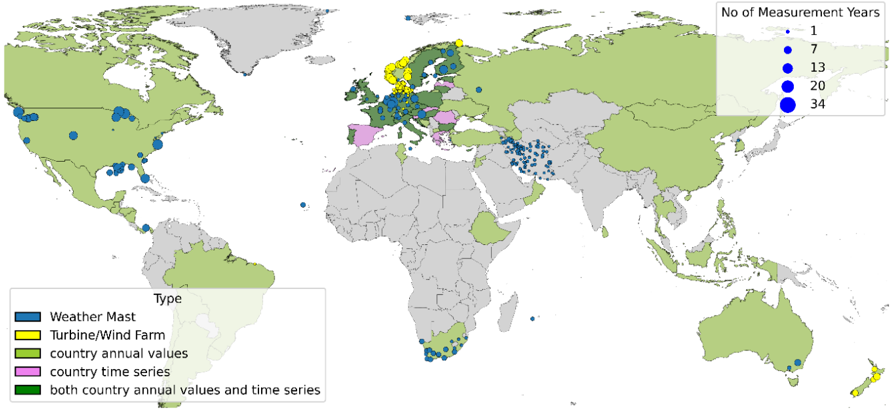
The image is a world map displaying the distribution of various types of measurement sites. The sites are represented by colored circles, with the size of the circle indicating the number of measurement years. A legend in the bottom-left corner identifies the site types, and a legend in the top-right corner corresponds to the circle sizes and measurement years. The map is predominantly light green, representing landmasses, with blue indicating oceans.
### Components/Axes
* **Map Projection:** Mercator projection (appears to be).
* **Legends:**
* **Site Type (Bottom-Left):**
* Blue: Weather Mast
* Dark Blue: Offshore/Wind Farm
* Yellow: Country annual values
* Pink: Country time series
* Green: Both country annual values and time series
* **Measurement Years (Top-Right):**
* White: 1 year
* Light Grey: 7 years
* Blue: 13 years
* Dark Blue: 20 years
* Darkest Blue: 34 years
* **Geographic Coverage:** Global, with a focus on Europe, North America, and parts of South America, Africa, and Asia.
* **Color Scheme:** Primarily uses shades of blue, green, yellow, and pink to differentiate site types.
### Detailed Analysis
The map shows a dense concentration of measurement sites in Europe, particularly in Northern and Western Europe. North America also has a significant number of sites, concentrated in the United States and Canada. The distribution in other regions is more sparse.
Here's a breakdown of site types and approximate counts (due to the density of some areas, these are estimates):
* **Weather Mast (Blue):** Numerous sites scattered globally, with concentrations along coastlines and in Europe. Circle sizes vary from 1 year (white) to 20 years (dark blue).
* **Offshore/Wind Farm (Dark Blue):** Predominantly located in Europe (North Sea, Baltic Sea, Atlantic coast) and along the eastern coast of the United States. Sizes range from 7 years (light grey) to 34 years (darkest blue).
* **Country Annual Values (Yellow):** Primarily found in Europe, with a few scattered locations in other parts of the world. Sizes range from 1 year (white) to 13 years (blue).
* **Country Time Series (Pink):** Concentrated in Europe, with a few sites in South America and Asia. Sizes range from 1 year (white) to 7 years (light grey).
* **Both Country Annual Values and Time Series (Green):** Widely distributed, with a significant presence in Europe, North America, and parts of South America and Africa. Sizes range from 1 year (white) to 20 years (dark blue).
**Specific Observations (Approximate):**
* **Europe:** High density of all site types, with many sites having 20+ years of measurement data.
* **North America:** Primarily green (both annual and time series data), with a mix of measurement durations.
* **South America:** Sparse distribution, mostly green sites with shorter measurement durations (1-7 years).
* **Africa:** Very sparse distribution, mostly green sites with shorter measurement durations (1-7 years).
* **Asia:** Scattered sites, with a mix of types and durations.
* **Australia/Oceania:** Few sites, mostly green with shorter measurement durations.
### Key Observations
* **European Dominance:** Europe clearly has the most extensive network of measurement sites, and the longest measurement durations.
* **Data Type Diversity:** The presence of multiple site types (Weather Mast, Wind Farm, Annual Values, Time Series) suggests a comprehensive approach to data collection.
* **Measurement Duration:** The variation in circle sizes indicates a range of measurement durations, with some sites having decades of data.
* **Geographic Gaps:** Significant regions, such as much of Africa, South America, and Asia, have limited measurement coverage.
### Interpretation
This map demonstrates a global effort to collect data related to weather and wind resources, likely for renewable energy applications (specifically wind energy, given the presence of offshore/wind farm sites). The concentration of sites in Europe suggests a historical focus on wind energy development in that region. The varying measurement durations indicate that some sites have been continuously monitoring conditions for decades, providing valuable long-term datasets. The geographic gaps highlight areas where further investment in measurement infrastructure is needed to improve data coverage and support future renewable energy projects. The combination of different site types suggests a multi-faceted approach to data collection, encompassing both localized measurements (Weather Masts) and broader regional assessments (Country Annual Values and Time Series). The presence of both annual and time series data indicates an interest in both short-term variability and long-term trends. The map is a visual representation of a global monitoring network, and the data collected from these sites is likely used for resource assessment, forecasting, and validation of climate models.