\n
## Diagram: Frame 7 (Bounce Peak)
### Overview
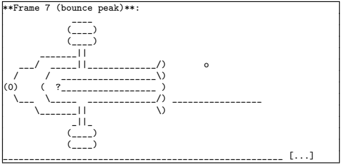
The image presents a diagram labeled "Frame 7 (bounce peak)::". It depicts a branching structure with lines and bracket-like shapes, suggesting a visual representation of a process or state transition. The diagram is largely schematic and lacks quantitative data, focusing instead on the relationships between elements.
### Components/Axes
The diagram consists of the following elements:
* **Frame Label:** "**Frame 7 (bounce peak)::**" located at the top-left corner.
* **Root Node:** A point labeled "(0)" on the left side.
* **Branching Lines:** Multiple horizontal lines extending from the root node, some terminating in bracket-like structures.
* **Bracket-like Structures:** These appear in pairs, resembling open and closed brackets, positioned at the ends of some lines.
* **Question Mark:** A question mark enclosed in parentheses "( ? )" is present within the branching structure.
* **Isolated Point:** A single dot "°" is located in the upper-right quadrant.
* **Ellipsis:** An ellipsis "[...]" is located at the bottom-right corner.
* **Dashed Lines:** Dashed lines connect various elements, indicating relationships or pathways.
### Detailed Analysis or Content Details
The diagram's structure can be described as follows:
1. A root node labeled "(0)" initiates the branching.
2. Several horizontal lines emanate from the root node.
3. The upper set of lines terminate in bracket-like structures: "[[ ]]" and "[[ ]]"
4. The central lines contain a question mark "( ? )" and terminate in bracket-like structures.
5. The lower set of lines terminate in bracket-like structures: "[[ ]]" and "[[ ]]"
6. A dashed line connects the root node to the upper bracket structures.
7. A dashed line connects the root node to the lower bracket structures.
8. A dashed line extends horizontally across the diagram, connecting the branching lines.
9. An isolated dot "°" is positioned to the right of the branching structure.
10. An ellipsis "[...]" is positioned at the bottom-right of the diagram.
There are no numerical values or scales present in the diagram. The diagram is purely qualitative.
### Key Observations
* The bracket-like structures suggest a state or condition.
* The question mark indicates uncertainty or an unknown state.
* The isolated dot may represent a separate entity or outcome.
* The ellipsis suggests continuation or incompleteness.
* The diagram's overall structure resembles a decision tree or a branching process.
### Interpretation
The diagram likely represents a stage in a dynamic process, possibly a simulation or a model of a system exhibiting "bounce peak" behavior. The root node "(0)" could represent an initial state, and the branching lines represent possible pathways or outcomes. The bracket-like structures might signify stable states or conditions reached at the end of each pathway. The question mark indicates a point of uncertainty or a decision point where the outcome is not yet determined. The isolated dot could represent an outlier or a separate event. The ellipsis suggests that the process continues beyond the scope of the diagram.
The "bounce peak" label suggests that the system experiences a period of oscillation or rebound before reaching a stable state. The diagram could be visualizing the different possible trajectories the system can take during this "bounce peak" phase. Without further context, it is difficult to determine the specific meaning of the diagram, but it appears to be a schematic representation of a complex process with multiple possible outcomes.