## Bar Chart: BLEU Score Comparison
### Overview
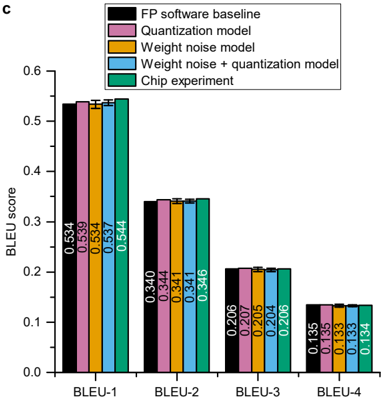
The image is a bar chart comparing BLEU scores across different models and experimental setups. The x-axis represents different BLEU metrics (BLEU-1 to BLEU-4), and the y-axis represents the BLEU score, ranging from 0.0 to 0.6. The chart compares the performance of "FP software baseline", "Quantization model", "Weight noise model", "Weight noise + quantization model", and "Chip experiment".
### Components/Axes
* **Title:** Implicit, but the chart compares BLEU scores.
* **X-axis:** BLEU metrics (BLEU-1, BLEU-2, BLEU-3, BLEU-4).
* **Y-axis:** BLEU score, ranging from 0.0 to 0.6 in increments of 0.1.
* **Legend:** Located in the top-right corner.
* Black: FP software baseline
* Pink: Quantization model
* Orange: Weight noise model
* Blue: Weight noise + quantization model
* Green: Chip experiment
### Detailed Analysis
The chart presents BLEU scores for each model across BLEU-1 to BLEU-4 metrics. Each metric has 5 bars representing the 5 different models. Error bars are present, but small.
**BLEU-1:**
* FP software baseline (Black): 0.534
* Quantization model (Pink): 0.539
* Weight noise model (Orange): 0.534
* Weight noise + quantization model (Blue): 0.537
* Chip experiment (Green): 0.544
**BLEU-2:**
* FP software baseline (Black): 0.340
* Quantization model (Pink): 0.344
* Weight noise model (Orange): 0.341
* Weight noise + quantization model (Blue): 0.341
* Chip experiment (Green): 0.346
**BLEU-3:**
* FP software baseline (Black): 0.206
* Quantization model (Pink): 0.207
* Weight noise model (Orange): 0.205
* Weight noise + quantization model (Blue): 0.204
* Chip experiment (Green): 0.206
**BLEU-4:**
* FP software baseline (Black): 0.135
* Quantization model (Pink): 0.135
* Weight noise model (Orange): 0.133
* Weight noise + quantization model (Blue): 0.133
* Chip experiment (Green): 0.134
### Key Observations
* BLEU scores decrease from BLEU-1 to BLEU-4 for all models.
* The "Chip experiment" generally achieves the highest BLEU scores across all metrics.
* The "Weight noise + quantization model" generally achieves the lowest BLEU scores across all metrics.
* The differences between the models are more pronounced for BLEU-1 and BLEU-2 compared to BLEU-3 and BLEU-4.
### Interpretation
The chart demonstrates the performance of different models and experimental setups based on BLEU scores. The BLEU score is a common metric for evaluating the quality of machine translation. The decreasing trend from BLEU-1 to BLEU-4 suggests that the models perform better on shorter sequences or phrases. The "Chip experiment" consistently outperforming the other models indicates that the chip implementation is more effective than the software-based models. The "Weight noise + quantization model" performing the worst suggests that combining these techniques might negatively impact the translation quality. The small error bars suggest that the results are statistically significant.