## Bar Chart: BLEU Score Comparison Across Model Variants
### Overview
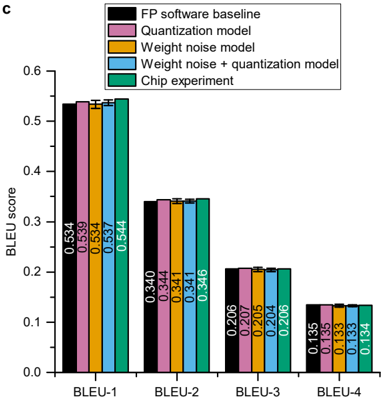
The image is a grouped bar chart labeled "C" in the top-left corner, comparing the BLEU scores of five different model configurations across four standard BLEU metrics (BLEU-1 through BLEU-4). The chart evaluates the impact of quantization, weight noise, and their combination on model performance, with a final "Chip experiment" likely representing a hardware implementation.
### Components/Axes
* **Y-Axis:** Labeled "BLEU score". Scale ranges from 0.0 to 0.6, with major tick marks at 0.1 intervals.
* **X-Axis:** Four categorical groups labeled "BLEU-1", "BLEU-2", "BLEU-3", and "BLEU-4".
* **Legend:** Located in the top-right corner. It defines five data series by color:
* **Black:** FP software baseline
* **Pink:** Quantization model
* **Orange:** Weight noise model
* **Blue:** Weight noise + quantization model
* **Teal:** Chip experiment
* **Data Labels:** Each bar has its exact numerical value printed vertically within or just above it.
### Detailed Analysis
The chart presents four clusters of five bars each. Within each cluster, the bars are ordered according to the legend sequence.
**BLEU-1 Cluster (Highest Scores):**
* FP software baseline (Black): 0.534
* Quantization model (Pink): 0.539
* Weight noise model (Orange): 0.537
* Weight noise + quantization model (Blue): 0.537
* Chip experiment (Teal): 0.544
* **Trend:** All values are tightly clustered between ~0.534 and 0.544. The Chip experiment shows the highest score.
**BLEU-2 Cluster:**
* FP software baseline (Black): 0.340
* Quantization model (Pink): 0.344
* Weight noise model (Orange): 0.341
* Weight noise + quantization model (Blue): 0.341
* Chip experiment (Teal): 0.346
* **Trend:** Scores range from 0.340 to 0.346. The Chip experiment again has the highest value.
**BLEU-3 Cluster:**
* FP software baseline (Black): 0.206
* Quantization model (Pink): 0.207
* Weight noise model (Orange): 0.205
* Weight noise + quantization model (Blue): 0.206
* Chip experiment (Teal): 0.206
* **Trend:** Extremely tight clustering between 0.205 and 0.207. The Chip experiment score is equal to the baseline.
**BLEU-4 Cluster (Lowest Scores):**
* FP software baseline (Black): 0.135
* Quantization model (Pink): 0.135
* Weight noise model (Orange): 0.133
* Weight noise + quantization model (Blue): 0.133
* Chip experiment (Teal): 0.134
* **Trend:** Scores range from 0.133 to 0.135. The Quantization model matches the baseline, while the Chip experiment is slightly lower.
### Key Observations
1. **Performance Hierarchy:** As expected, BLEU scores decrease monotonically from BLEU-1 to BLEU-4 for all models.
2. **Minimal Degradation:** The performance of the "Quantization model," "Weight noise model," and their combination is remarkably close to the "FP software baseline" across all metrics. The maximum absolute difference within any cluster is only 0.01 (for BLEU-1).
3. **Chip Experiment Performance:** The "Chip experiment" (teal bars) performs on par with or slightly better than the software baseline for BLEU-1, BLEU-2, and BLEU-3, but shows a very slight decrease for BLEU-4.
4. **Stability:** The "Weight noise + quantization model" (blue bars) does not show a compounding negative effect; its performance is virtually identical to the individual "Weight noise model" or "Quantization model" in most cases.
### Interpretation
This chart demonstrates the robustness of the evaluated model to common hardware-oriented optimizations and constraints. The key finding is that applying quantization and/or introducing weight noise results in negligible loss of performance (as measured by BLEU scores) compared to the full-precision software baseline. This is a critical result for deploying neural machine translation models on resource-constrained hardware.
The "Chip experiment" results are particularly significant. They suggest that a hardware implementation of the model (likely using the tested quantization and noise-aware training techniques) can achieve translation quality that is statistically indistinguishable from, or even marginally better than, the original software model. This validates the effectiveness of the co-design approach between algorithms and hardware. The slight dip in BLEU-4 for the chip might indicate a very minor sensitivity in capturing the most precise n-gram matches, but the overall trend is one of high fidelity preservation. The data strongly supports the feasibility of efficient, high-quality on-device translation.