## Bar Chart: BLEU Score Comparison Across Models
### Overview
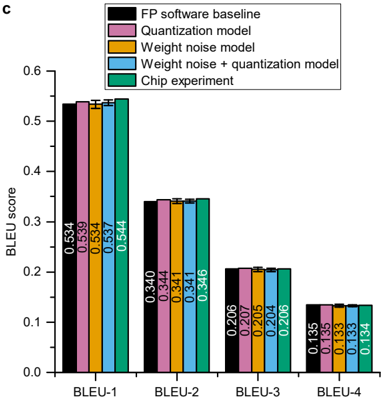
The chart compares BLEU scores (a metric for translation quality) across four BLEU categories (BLEU-1 to BLEU-4) for five different models: FP software baseline, Quantization model, Weight noise model, Weight noise + quantization model, and Chip experiment. The y-axis represents BLEU scores (0–0.6), and the x-axis lists BLEU categories. Each model is represented by a distinct color-coded bar.
### Components/Axes
- **X-axis**: Labeled "BLEU-1", "BLEU-2", "BLEU-3", "BLEU-4" (categorical).
- **Y-axis**: Labeled "BLEU score" with a scale from 0.0 to 0.6 in increments of 0.1.
- **Legend**: Located at the top-right, with five entries:
- **FP software baseline** (black)
- **Quantization model** (pink)
- **Weight noise model** (orange)
- **Weight noise + quantization model** (blue)
- **Chip experiment** (green)
- **Bars**: Grouped by BLEU category, with one bar per model. Colors match the legend.
### Detailed Analysis
#### BLEU-1
- **FP software baseline**: 0.534 (black)
- **Quantization model**: 0.539 (pink)
- **Weight noise model**: 0.537 (orange)
- **Weight noise + quantization model**: 0.544 (blue)
- **Chip experiment**: 0.544 (green)
#### BLEU-2
- **FP software baseline**: 0.344 (black)
- **Quantization model**: 0.341 (pink)
- **Weight noise model**: 0.341 (orange)
- **Weight noise + quantization model**: 0.346 (blue)
- **Chip experiment**: 0.346 (green)
#### BLEU-3
- **FP software baseline**: 0.206 (black)
- **Quantization model**: 0.205 (pink)
- **Weight noise model**: 0.204 (orange)
- **Weight noise + quantization model**: 0.207 (blue)
- **Chip experiment**: 0.206 (green)
#### BLEU-4
- **FP software baseline**: 0.135 (black)
- **Quantization model**: 0.133 (pink)
- **Weight noise model**: 0.133 (orange)
- **Weight noise + quantization model**: 0.134 (blue)
- **Chip experiment**: 0.134 (green)
### Key Observations
1. **Chip experiment** consistently achieves the highest BLEU scores in BLEU-1 and BLEU-2, with scores of 0.544 and 0.346, respectively.
2. **Weight noise model** underperforms in BLEU-3 and BLEU-4, with scores of 0.204 and 0.133, respectively.
3. **Weight noise + quantization model** shows slightly better performance than the standalone Weight noise model in BLEU-3 (0.207 vs. 0.204) and BLEU-4 (0.134 vs. 0.133).
4. **FP software baseline** has the lowest scores across all BLEU categories, except in BLEU-1 where it is close to the Quantization model (0.534 vs. 0.539).
### Interpretation
The chart demonstrates that the **Chip experiment** model outperforms other approaches in early BLEU categories (BLEU-1 and BLEU-2), suggesting it is more effective at capturing high-precision translation metrics. The **Weight noise + quantization model** shows marginal improvements over the standalone Weight noise model, indicating that combining these techniques may mitigate some performance degradation. The **FP software baseline** consistently underperforms, highlighting its limitations in translation quality. Notably, the **Chip experiment**'s scores drop significantly in BLEU-4 (0.134), which may reflect challenges in handling lower-precision or more nuanced translation tasks. This data suggests that model architecture and noise management strategies critically influence translation quality metrics.