## Diagram: Causal Relationship Network
### Overview
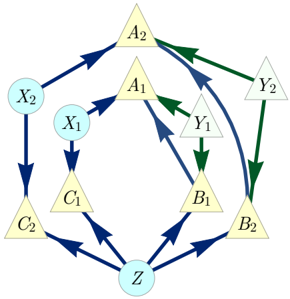
This image depicts a directed graph illustrating potential causal relationships between various nodes. The nodes are represented by different shapes and colors, and the directed edges (arrows) indicate the direction of influence or causality.
### Components/Axes
There are no explicit axes or legends in this diagram. The components are:
* **Nodes:**
* **Light Blue Circles:** X1, X2, Z
* **Yellow Triangles:** A1, A2, C1, C2
* **Light Green Triangles:** Y1, Y2
* **Light Yellow Triangles:** B1, B2
* **Edges:** Directed arrows connecting the nodes. The arrows are colored in dark blue and dark green.
### Detailed Analysis or Content Details
The diagram shows the following connections:
* **Dark Blue Arrows:**
* X2 points to C2.
* X1 points to C1.
* Z points to C1.
* Z points to B2.
* C2 points to Z.
* C1 points to A1.
* B2 points to A2.
* A1 points to A2.
* A1 points to Y1.
* A2 points to Y2.
* B1 points to A1.
* B1 points to Y1.
* **Dark Green Arrows:**
* A2 points to Y1.
* A2 points to Y2.
* Y1 points to B1.
* Y2 points to B2.
### Key Observations
The diagram illustrates a complex network of influences. Some nodes appear to be sources of influence (e.g., X1, X2, Z), while others are intermediate or terminal nodes. There are cycles in the network, for example, Z -> C1 -> A1 -> A2 -> Y2 -> B2 -> Z (partially, as A1 also points to Y1, and B1 points to A1 and Y1). The presence of both dark blue and dark green arrows suggests potentially different types of relationships or influences, though this is not explicitly defined.
### Interpretation
This diagram likely represents a model of causal relationships within a system. The different node types (circles and triangles) and colors might represent different categories of variables or entities (e.g., exogenous vs. endogenous, different types of factors). The directed arrows signify that a change or presence in the source node is hypothesized to cause a change or presence in the target node.
The presence of cycles (feedback loops) is significant, as it implies that the system can be dynamic and self-reinforcing or self-regulating. For instance, the loop involving Z, C1, A1, A2, Y2, and B2 suggests a complex interplay where these elements can influence each other over time. The distinct colors of the arrows (dark blue and dark green) could represent different strengths of causality, different mechanisms of influence, or different categories of causal links. Without a legend or further context, the precise meaning of these distinctions remains speculative.
The overall structure suggests a system where initial inputs (like X1, X2, Z) propagate through various intermediate stages (C1, C2, A1, A2, B1, B2) and lead to observable outcomes (Y1, Y2). The diagram is a visual representation of a hypothesis about how these elements interact.