\n
## Diagram: Flow Network
### Overview
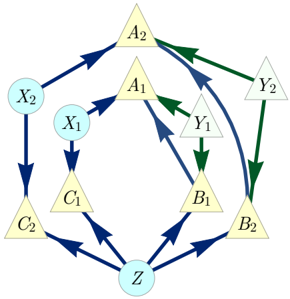
The image depicts a directed graph representing a flow network. The network consists of nodes connected by directed edges (arrows). Nodes are represented as either circles or triangles, and edges indicate the direction of flow. The diagram appears to illustrate a system with inputs (X1, X2), intermediate stages (A1, A2, B1, B2, C1, C2, Y1, Y2), and a final output (Z).
### Components/Axes
The diagram contains the following nodes:
* X1 (Circle, light blue)
* X2 (Circle, light blue)
* Z (Circle, light blue)
* A1 (Triangle, yellow)
* A2 (Triangle, yellow)
* B1 (Triangle, yellow)
* B2 (Triangle, yellow)
* C1 (Triangle, yellow)
* C2 (Triangle, yellow)
* Y1 (Triangle, yellow)
* Y2 (Triangle, yellow)
The diagram contains edges of two colors:
* Dark Blue: Represents the primary flow direction.
* Dark Green: Represents a secondary flow direction.
### Detailed Analysis or Content Details
The flow network can be described as follows:
* X2 flows into C2.
* C2 flows into Z.
* X1 flows into C1.
* C1 flows into Z.
* C1 flows into A1.
* A1 flows into Y1.
* Y1 flows into B1.
* B1 flows into Z.
* A1 flows into A2.
* A2 flows into Y2.
* Y2 flows into B2.
* B2 flows into Z.
* Y1 flows into Y2.
* A2 flows into B2.
### Key Observations
The network exhibits a complex flow pattern with multiple paths from the input nodes (X1, X2) to the output node (Z). There are both direct and indirect paths. The green edges appear to represent alternative or secondary flow routes. The network is symmetrical in some aspects, with corresponding nodes and edges on either side of the Z node.
### Interpretation
This diagram likely represents a system where resources or information flow through a series of processing stages. The nodes could represent different components or states within the system, and the edges represent the transitions between these states. The two colors of edges suggest different types of flow or different priorities. The symmetry of the network might indicate a balanced or redundant system. The diagram could be a simplified model of a chemical process, a communication network, or a control system. The presence of multiple paths to the output (Z) suggests robustness or the ability to handle variations in input or component failures. The diagram does not provide quantitative data, so it is difficult to assess the efficiency or capacity of the network. It is a qualitative representation of the system's structure and flow.