## Flowchart Diagram: System Process Flow
### Overview
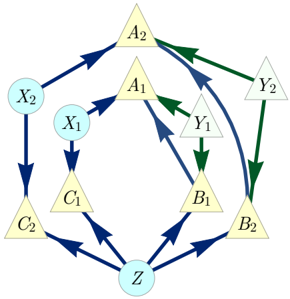
The image depicts a directed flowchart with 11 nodes (labeled A1, A2, B1, B2, C1, C2, X1, X2, Y1, Y2, Z) and 12 directed edges. The diagram uses three arrow colors (blue, green, dark blue) to distinguish connection types. The structure suggests a multi-stage process with feedback loops and branching pathways.
### Components/Axes
- **Nodes**:
- Central node: Z (light blue circle)
- Intermediate nodes: C1, C2 (yellow triangles), A1, A2, B1, B2 (yellow triangles)
- Terminal nodes: X1, X2, Y1, Y2 (light blue circles)
- **Edges**:
- **Blue arrows**: Primary connections (e.g., Z→C1, C1→A1)
- **Green arrows**: Secondary connections (e.g., A1→A2, B1→B2)
- **Dark blue arrows**: Feedback/loop connections (e.g., A2→A1)
- **Spatial Layout**:
- Bottom: Z (central hub)
- Middle: C1/C2 (left/right branches)
- Top: A1/A2 (left), B1/B2 (right)
- Right: Y1/Y2 (output cluster)
- Loop: A2→A1 (right-side feedback)
### Detailed Analysis
1. **Node Connections**:
- **Z** (bottom center) → C1 (blue) and C2 (blue)
- **C1** → A1 (blue) and X1 (dark blue)
- **C2** → B1 (blue) and X2 (dark blue)
- **A1** → A2 (green) and Y1 (dark blue)
- **B1** → B2 (green) and Y2 (dark blue)
- **A2** → A1 (dark blue, feedback loop)
- **B2** → Y2 (dark blue, terminal)
- **Y1/Y2** have no outgoing edges (final outputs)
2. **Color-Coded Relationships**:
- **Blue**: Core process flow (80% of connections)
- **Green**: Secondary/optional pathways (2 connections)
- **Dark Blue**: Feedback/termination (3 connections)
### Key Observations
- **Feedback Loop**: A2→A1 creates a cyclical dependency, suggesting iterative refinement or error correction.
- **Divergent Paths**: C1 and C2 split into A1/B1 branches, indicating parallel processing streams.
- **Convergence**: Y1/Y2 act as terminal nodes, possibly representing final outputs or decision points.
- **X1/X2**: Isolated nodes with only incoming dark blue arrows, potentially representing error states or dead ends.
### Interpretation
This diagram likely models a **multi-stage decision-making system** with:
1. **Input Stage**: Z (central resource) feeds into two parallel processes (C1/C2).
2. **Processing Streams**:
- **A-path**: C1→A1→A2 (with feedback to A1)
- **B-path**: C2→B1→B2 (linear progression)
3. **Output Stage**: Y1/Y2 as final results, with X1/X2 as potential failure states.
4. **Regulatory Mechanism**: The A2→A1 loop implies self-correction or iterative optimization.
The color coding emphasizes **process hierarchy** (blue > green > dark blue), while the spatial layout separates input, processing, and output phases. The feedback loop in the A-path suggests a focus on refinement, whereas the B-path represents a more linear workflow. X1/X2 may indicate system vulnerabilities or termination points requiring further analysis.