## Heatmap Grid: Recurrence vs Hops with ID/OOD and Train Recurrence Boundaries
### Overview
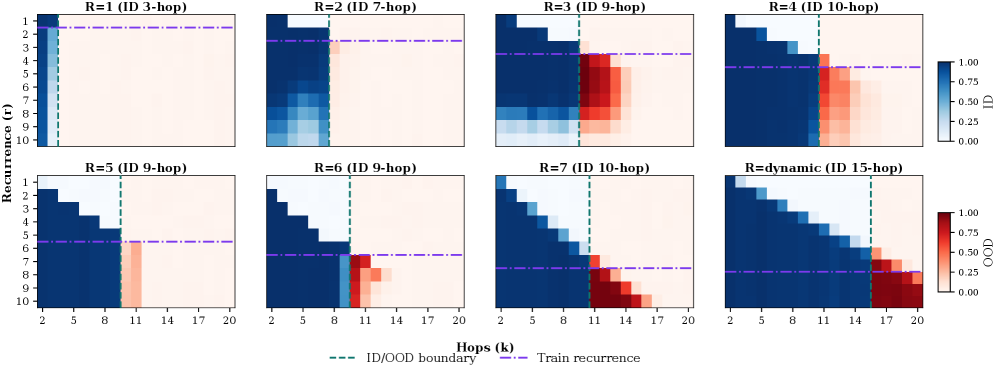
The image displays a 2x4 grid of heatmaps visualizing the relationship between **Recurrence (r)** and **Hops (k)** across different model configurations. Each heatmap represents a unique combination of **R** (model parameter) and **ID hop count**, with color gradients indicating the magnitude of two metrics: **ID/OOD boundary** (blue) and **Train recurrence** (red). Dashed lines demarcate critical thresholds for these metrics.
---
### Components/Axes
1. **X-axis (Hops, k)**: Ranges from 2 to 20, labeled in increments of 1.
2. **Y-axis (Recurrence, r)**: Ranges from 1 to 10, labeled in increments of 1.
3. **Color Legend**:
- **Blue**: ID/OOD boundary (values 0.00–0.75).
- **Red**: Train recurrence (values 0.00–1.00).
- **Purple Dashed Line**: Train recurrence threshold (constant across all plots).
- **Green Dashed Line**: ID/OOD boundary threshold (constant across all plots).
4. **Heatmap Titles**: Each plot is labeled with `R=X (ID Y-hop)`, where:
- `R`: Model parameter (1, 2, 3, 4, 5, 6, 7, dynamic).
- `Y`: ID hop count (3, 7, 9, 10, 15).
---
### Detailed Analysis
#### Heatmap 1: R=1 (ID 3-hop)
- **Color Distribution**: Left side (k=2–8) is dark blue (low ID/OOD boundary). Right side (k=11–20) is white (no Train recurrence).
- **Thresholds**:
- ID/OOD boundary (green line) at k=10.
- Train recurrence (purple line) at r=5.
#### Heatmap 2: R=2 (ID 7-hop)
- **Color Distribution**: Left side (k=2–8) dark blue; middle (k=9–11) transitions to light blue; right side (k=12–20) white.
- **Thresholds**: Same as above.
#### Heatmap 3: R=3 (ID 9-hop)
- **Color Distribution**: Left (k=2–8) dark blue; middle (k=9–14) red (high Train recurrence); right (k=15–20) white.
- **Thresholds**: Same as above.
#### Heatmap 4: R=4 (ID 10-hop)
- **Color Distribution**: Left (k=2–8) dark blue; middle (k=9–13) red; right (k=14–20) white.
- **Thresholds**: Same as above.
#### Heatmap 5: R=5 (ID 9-hop)
- **Color Distribution**: Left (k=2–8) dark blue; middle (k=9–11) red; right (k=12–20) white.
- **Thresholds**: Same as above.
#### Heatmap 6: R=6 (ID 9-hop)
- **Color Distribution**: Left (k=2–8) dark blue; middle (k=9–12) red; right (k=13–20) white.
- **Thresholds**: Same as above.
#### Heatmap 7: R=7 (ID 10-hop)
- **Color Distribution**: Left (k=2–8) dark blue; middle (k=9–14) red; right (k=15–20) white.
- **Thresholds**: Same as above.
#### Heatmap 8: R=dynamic (ID 15-hop)
- **Color Distribution**: Gradient from dark blue (k=2–10) to red (k=11–20), with no clear boundary.
- **Thresholds**: Same as above.
---
### Key Observations
1. **ID/OOD Boundary**:
- Consistently marked by a vertical green dashed line at **k=10** for all static R values.
- Dynamic R=15-hop shows no sharp boundary, suggesting a continuous transition.
2. **Train Recurrence**:
- Purple dashed line at **r=5** across all plots.
- Red regions (high recurrence) appear only for R≥3 and k≥9.
3. **R Parameter Impact**:
- Higher R values (e.g., R=3–7) show earlier activation of Train recurrence (k=9–14).
- Dynamic R=15-hop exhibits a smooth gradient, implying parameter-dependent behavior.
4. **Hop Count Correlation**:
- Train recurrence increases with k for R≥3, peaking at k=10–14.
- ID/OOD boundary remains fixed at k=10 for static R values.
---
### Interpretation
The heatmaps reveal that **model parameter R** and **ID hop count** jointly influence the recurrence of training patterns and the separation between in-distribution (ID) and out-of-distribution (OOD) data.
- **Static R Values**:
- Train recurrence (red) activates only when k exceeds the ID/OOD boundary (k=10), suggesting that higher hop counts destabilize the model’s ability to generalize.
- Higher R values (e.g., R=3–7) trigger recurrence earlier, indicating sensitivity to parameter scaling.
- **Dynamic R=15-hop**:
- The absence of a sharp ID/OOD boundary implies that dynamic R adapts to hop counts, potentially mitigating abrupt transitions.
- **Critical Thresholds**:
- The fixed r=5 threshold for Train recurrence may represent a tipping point where the model begins to overfit or memorize training data.
This analysis highlights the interplay between model architecture (R), data complexity (hops), and generalization performance, offering insights for optimizing model robustness.