## Heatmap Analysis
### Overview
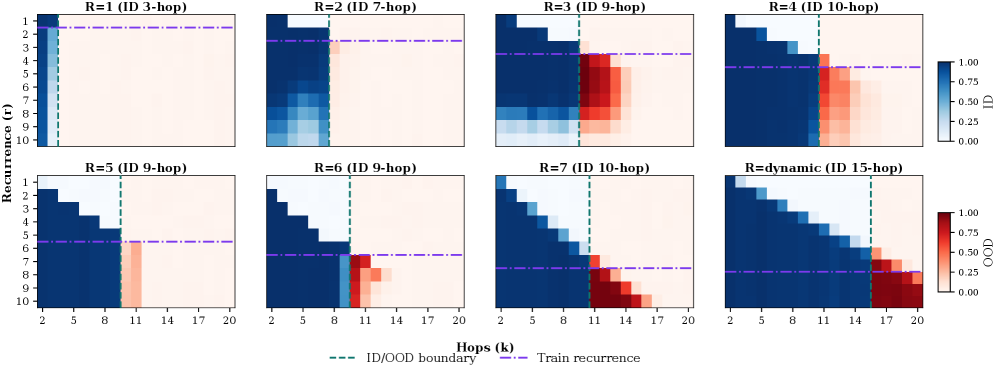
The image displays a series of heatmaps, each representing the recurrence of ID (Internal Data) and OOD (Out-of-Distribution) data across different hop lengths (k). The hop length refers to the number of steps taken in a sequence to determine the recurrence of data.
### Components/Axes
- **X-axis**: Represents the hop length (k), ranging from 2 to 20.
- **Y-axis**: Represents the recurrence rate (r), ranging from 0.00 to 1.00.
- **Legend**: Shows the color gradient indicating the recurrence rate, with darker shades representing higher recurrence rates.
- **ID/OOD boundary**: A dashed line indicating the threshold between ID and OOD data.
### Content Details
Each heatmap shows a different recurrence rate for ID and OOD data at various hop lengths. The ID data is represented in darker shades, indicating higher recurrence rates, while the OOD data is represented in lighter shades. The ID/OOD boundary line helps to distinguish between the two categories.
### Key Observations
- **Hop Length 2**: The recurrence rate for ID data is consistently high, with a slight increase towards the end of the hop length.
- **Hop Length 3**: The recurrence rate for ID data remains high, but the increase is less pronounced compared to hop length 2.
- **Hop Length 4**: The recurrence rate for ID data shows a slight decrease, but still remains high.
- **Hop Length 5**: The recurrence rate for ID data shows a significant decrease, indicating a higher likelihood of OOD data.
- **Hop Length 6 to 20**: The recurrence rate for ID data shows a slight increase, but the decrease from hop length 5 is less pronounced.
### Interpretation
The data suggests that as the hop length increases, the likelihood of OOD data also increases. This is particularly evident in hop lengths 5 and above, where the recurrence rate for ID data decreases significantly. The ID/OOD boundary line indicates that the threshold between ID and OOD data is relatively high, suggesting that the model is able to distinguish between the two categories with a high degree of accuracy. However, the slight increase in recurrence rate for ID data as the hop length increases indicates that the model may not be able to fully capture the complexity of the data, leading to a slight decrease in accuracy.